Create a Top Bottom N Filter
Use the Top Bottom N filter type to filter an attribute or measure to display a subset of its highest or lowest values.
When you create a Top Bottom N filter, you can choose how many top or bottom values to display. If your filter is an attribute, you can choose which measures to limit it by. If your filter is a measure, you can choose which attributes to limit it by.
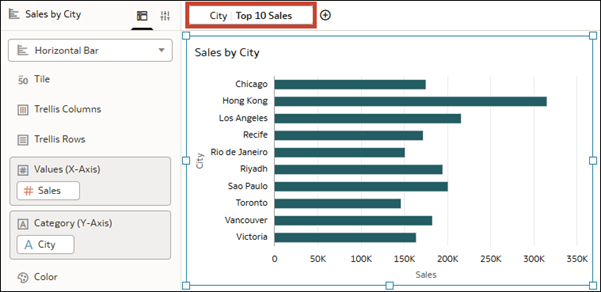
For example, you can filter a visualization by the top 10 cities based on sales. You can define a Top Bottom N filter in the filter bar to show the top 10 cities with the highest sales.
Description of the illustration filters_topbottomn_salesbycity.png
You can use top bottom N filters for all filter scopes.
To control the level of interactivity consumers have with a Top Bottom N filter, see Create and Bind Parameters to a Top Bottom N Filter.
- On your home page, hover over a workbook, click Actions, then select Open.
- In the Data pane, drag and drop the column you want to filter on to one of the following:
- The filter bar to create a canvas or workbook filter to broadly limit the data on one or all canvases.
- A dashboard filter on the canvas to create a dashboard filter control for consumers.
- The Filters area of the Grammar pane for a specific visualization to create a filter to limit data in only that visualization.
- Click the filter to open the Filter dialog and click Top Bottom N.
- Optional: In the Method row, click Top to change the method to Bottom.
- In the Count row, enter the number of values to display.
- In the By row, if your column is an attribute, click Select Measure or, if your column is a measure, click Select Attribute. Then select a measure or attribute to limit the filter by.
- Click Save.