Create and Bind Parameters to a Top Bottom N Filter
Create and bind parameters to a Top Bottom N filter to control how you want consumers to interact with the filter.
If you create a Top Bottom N filter and make it available to consumers, they have full access to adjust the Method, Count, and By properties, as well as change the filter type.
If you want to control the level of interactivity your consumers have with it, or make it easier for them to interact with, you can hide the filter, create and bind parameters to the Method and Count properties, and expose the parameters as dashboard filter controls for your consumers to use instead.
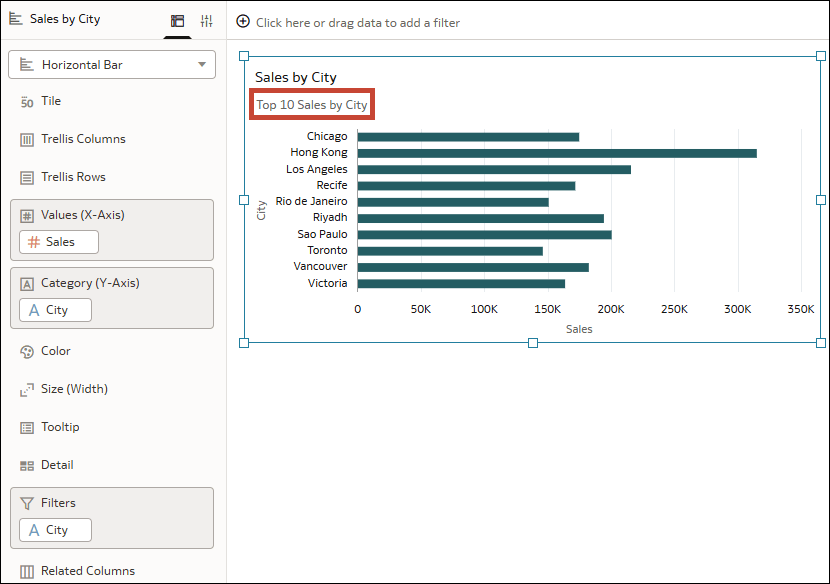
For example, suppose you have a visualization showing Sales by City with a Top Bottom N filter applied to it to show the top 10 cities with the highest sales.
Description of the illustration params_topbottomn_salesbycity.png
You want your consumers to be able to select different Method and Count values for the filter so they can explore different subsets of the top and bottom cities based on sales. You don't want your consumers to be able to change the By property or switch the filter type.
Description of the illustration params_topbottomn_salesbycity_filterdialog.png
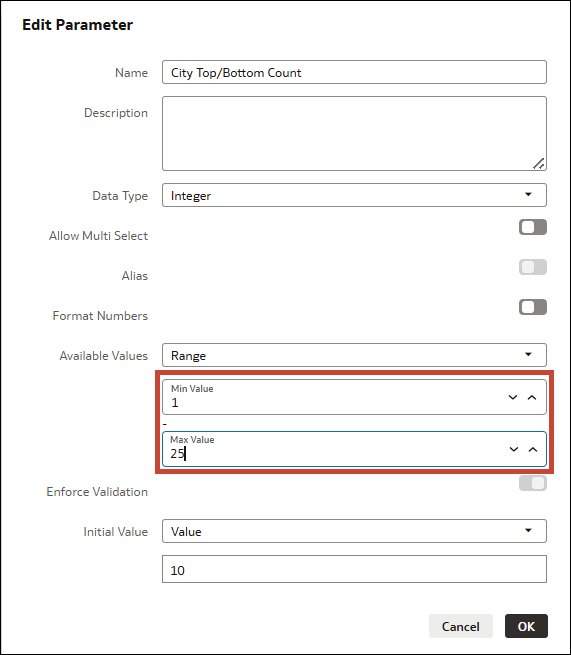
You can create a parameter called City Top/Bottom Method and another called City Top/Bottom Count, bind these parameters to the corresponding properties for the filter, and then use these parameters as filter controls in a dashboard filter. This lets your consumers switch between top and bottom and see the values within a specified range in the visualization.
Description of the illustration params_topbottomn_salesbycity_dashboardfilter.png


