Drill in Results
You can drill in results.
Topics:
About Drilling
Drilling enables you to navigate through hierarchical levels of data in views quickly and easily.
Many of the results that are displayed in views represent hierarchical data structures. The metadata specifies these hierarchies, and this enables you to access the different levels of detail within them.
-
Drill down to display data in more detail, which displays more members.
-
Drill up to display less data.
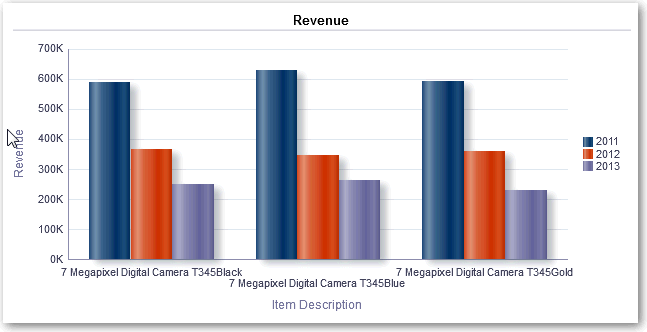
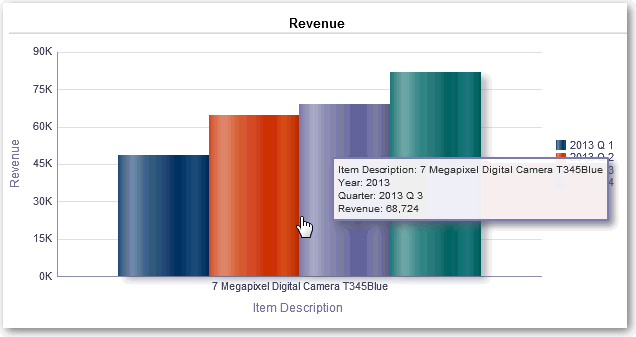
For example, in the results of the Brand Revenue analysis, you can drill for more data in the graph of Revenue by Product. To do this you can click on the MobilePhones data point. More data is displayed in the graph, such as the MobilePhones revenue per sales office for each of the last three years.
Drill in Tables and Other Views
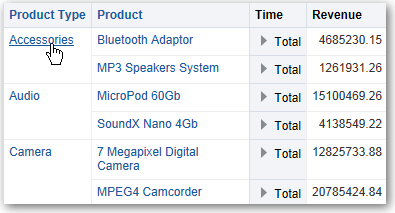
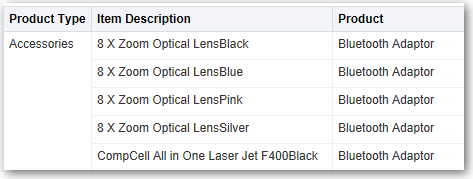
When you drill down in a table, pivot table, heat matrix, or trellis, the detail level data is added to the current data.
For example, when you drill from a continent, the table displays data for the continent and for the countries in that continent.
Drill in Graphs
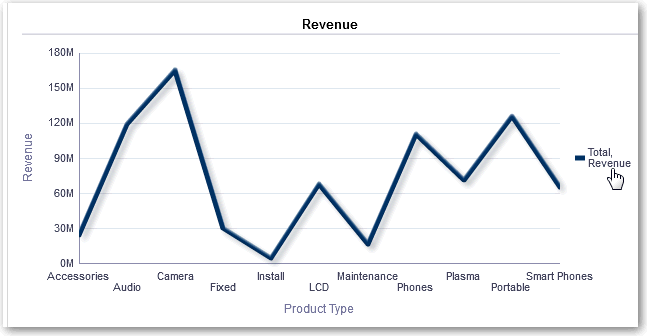
When you drill down in a graph, the detail level data replaces the current data.
For example, when you drill down from a continent, the graph displays data for the countries in that continent, but not for the continent itself.
Drill in Map Views
Drilling in a map enables you to navigate through the data. Drilling is available when the Pan tool is selected, as indicated by a hand cursor. If you hover over map data, then an information window is displayed with various information about that location.
When you click a region or a point on the map:
All columns in which you can drill are displayed in the information window as link text. When you click the link for a simple drill, you drill in the data, the map is redrawn with a different layer, and the information window is closed. If action links are defined, then you see a popup window that shows additional links.
Drilling updates map formatting to reflect the newly drilled data. For some drills (such as drilling on a State), the map zooms to the specified region while simultaneously updating the formatting. How you zoom and the formats and geographic levels that the map contains affect what is displayed. Formats have particular "zoom ranges" and are visible at different zoom levels. Zooming back up might display a new format, if you zoom out past the zoom level of the drilled format.
After you have drilled down, use the zoom slider to drill back up. Use the Return button on a dashboard page to display the original map view at the zoom or drill level that was in place before you started drilling.
