Example – Change the Limit Values Setting for a Visualization Filter
This example shows how to configure the Limit Values setting for a visualization filter.
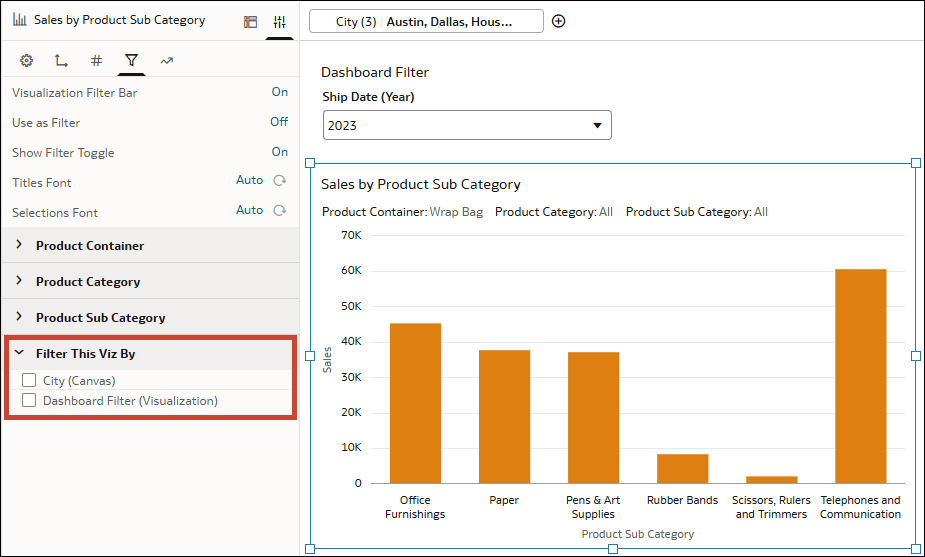
In this example, you have a bar chart showing Sales by Product Sub Category.
Description of the illustration filters_limit_values_example_sales_by_product.png
- In the Data pane, drag City to the filter bar.
- Click Visualizations and drag Dashboard Filters to your canvas.
- Click Data and drag Ship Date (Year) to the dashboard filters visualization.
- Click the bar chart visualization to select it.
- In the Data pane, drag Product Sub Category and Product Container to Filters in the Grammar pane.
The Limit Values By setting for the filter bar is set to Default. The Limit Values settings for each of these four filters are also set to Default.
Next, you change the Limit Values for Product Sub Category from Default to Auto, None, and Custom to see how that visualization filter is affected each time.
Here's what happens if you change the Limit Values setting for Product Sub Category to Auto:
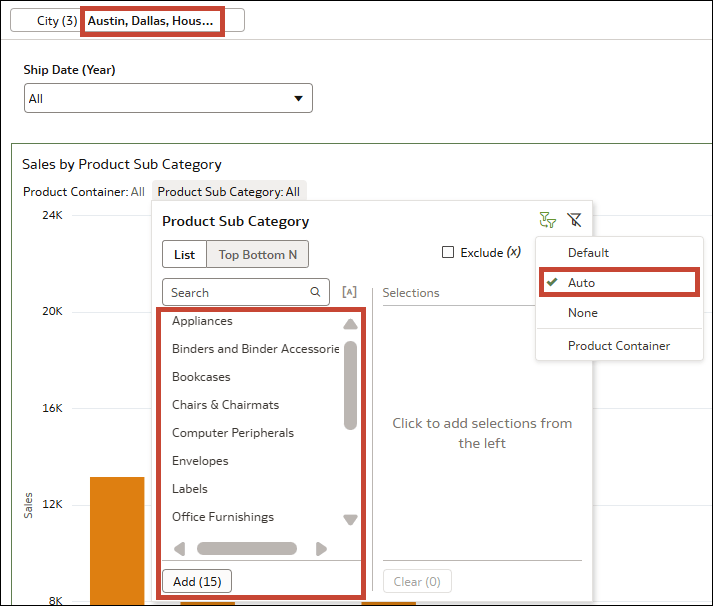
The values available to select from for Product Sub Category are limited by the selections you make for the canvas filter City, the dashboard filter Ship Date (Year), and the other visualization filter Product Container.
- Select Austin, Dallas, and Houston for City. There are only 15 values available to select for Product Sub Category because no products for the sub categories "Copiers and Fax" and "Scissors, Rulers and Trimmers" were sold in those three cities.
- Then select 2023 for Ship Date (Year). The values available to select for Product Sub Category are further reduced to 13 to reflect the ones used for the three cities in 2023.
- Then select Wrap Bag for Product Container. The values available to select for Product Sub Category are further reduced to just two.
- The values available to select from for Product Sub Category are back to 13. Only the selections you made for the canvas filter City and the dashboard filter Ship Date (Year) are considered as they're in higher filter locations. The selection you made for Product Container, Wrap Bag, is ignored.
- In this scenario, while the Product Sub Category filter is limited only by the City filter and the Ship Date (Year) filter, all four filters still apply to the visualization itself. This means that if you select any product sub category other than "Pens and Art Supplies" or "Telephones and Communication", no data displays in the visualization because those are the only two that use the Wrap Bag product container in Austin, Dallas, and Houston in 2023.
- This option is most useful if you have more than two visualization filters on your visualization, and you want to choose exactly which ones to limit Product Sub Category by.
- If you add a third filter control using the column Product Category, you can configure the Limit Values setting for Product Sub Category to be limited by only Product Container or by only Product Category, instead of both (Default and Auto) or neither (None).
- Product Container is still limited by City.
If you want to stop the City filter or the Ship Date (Year) filter from limiting the visualization filters, you need to go to the Filters tab in the Properties pane for the Sales by Product Sub Category visualization. Then, under Filter This Viz By, deselect City (Canvas) or Dashboard Filter (Visualization).
Description of the illustration filters_limit_values_example_viz_filterthisvizby.png


