Example – Change the Limit Values Setting for a Dashboard Filter
This example shows how to configure the Limit Values setting for a dashboard filter.
In this example, you have a bar chart showing Sales by Product Sub Category.
Description of the illustration filters_limit_values_example_sales_by_product.png
- In the Data pane, drag City to the filter bar.
- Click Visualizations and drag Dashboard Filters to your canvas.
- Click Data and drag Product Category and Product Container to the dashboard filters visualization.
The Limit Values By setting for the filter bar is set to Default. The Limit Values settings for each of these three filters are also set to Default.
Next, you change the Limit Values for Product Container from Default to Auto, None, and Custom to see how that dashboard filter is affected each time.
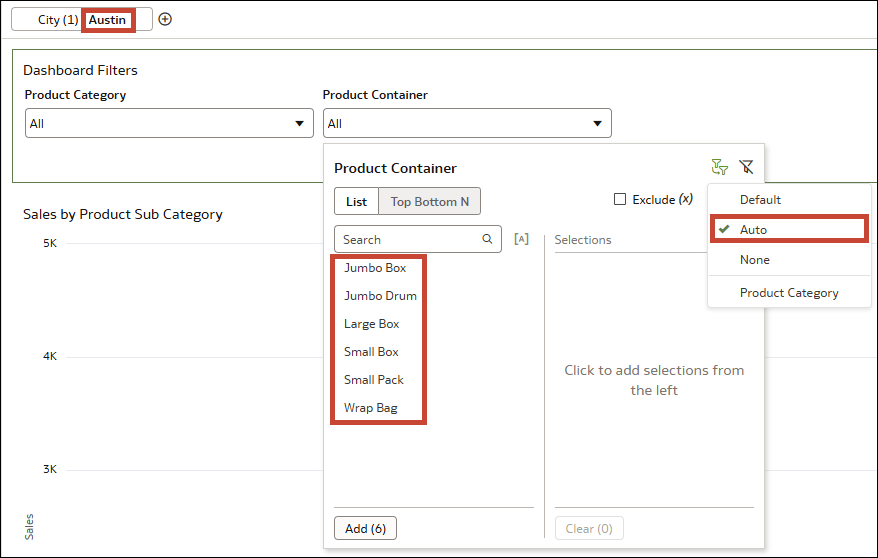
Here's what happens if you change the Limit Values setting for Product Container to Auto:
The values available to select from for Product Container are limited by the selections you make for the canvas filter City and by the selections you make for the other dashboard filter control Product Category.
- Select Austin for City. There are only six values available to select for Product Container because the container Medium Box isn't used for that city.
- Then select Office Supplies for Product Category. The values available to select for Product Container are further reduced to just four, those that are used for office supplies in Austin.
- The values available to select from for Product Container are only limited by the selection you made for the canvas filter City. All six of the Product Containers associated with Austin are now available. Even though you have Office Supplies selected for Product Category, that selection has no impact on the Product Container filter.
- In this scenario, while the Product Container filter is limited only by the City filter (because it's in a higher filter location), all three filters still apply to the visualization itself. This means that if you select Jumbo Box, no data displays in the visualization because that product container isn't used for office supplies in Austin.
- This option is most useful if you have more than two filter controls in your dashboard filter, and you want to choose exactly which ones to limit Product Container by.
- If you add a third filter control using the column Product Sub Category, you can configure the Limit Values setting for Product Container to be limited by only Product Category or by only Product Sub Category, instead of both (Default and Auto) or neither (None).
- Product Container is still limited by City.
If you want to stop the City filter from limiting the dashboard filters, you need to go to the Filters tab in the Properties pane for the dashboard filters visualization. Then, under Filter This Viz By, deselect City (Canvas).
Description of the illustration filters_limit_values_example_dashboard_filterthisvizby.png


