Use a Slider Dashboard Filter to Animate Visualizations
You can add a slider dashboard filter to a canvas and animate visualizations to show how the data changes relative to a specified dimension. Consumers can select a value interactively, or automatically play through dimension values, similar to a time-lapse video or animation.
You can use attribute and date columns as well as parameters as slider filter controls. When you use a parameter as a slider filter control, selecting a value or playing the slider automatically only updates the parameter value where it's used in the visualizations. When you use a column as a slider filter control, it filters the data in the visualizations like any other filter.
For example, suppose you have a workbook canvas with visualizations showing data on Olympic medals for swimming. You can use a slider filter with the column Year as a filter control to let consumers see how the data in the visualization changes between the years 2000 and 2012.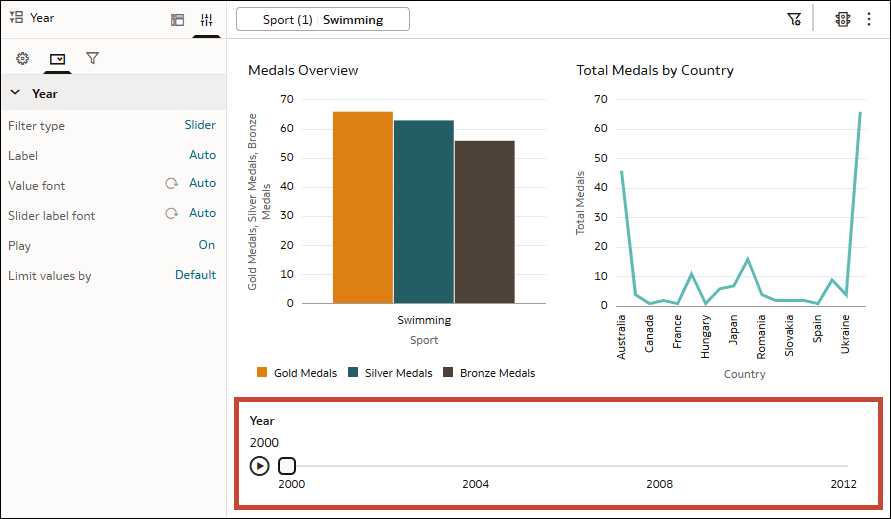
Description of the illustration filters_slider_example.png
For more information about slider filters, see Filter Types. For more information about slider properties, see Dashboard Filter Control Properties.

- On your home page, hover over a workbook, click Actions, and select Open.
- In the Data panel, click Visualizations, scroll to the Dashboard Controls section, and drag Dashboard Filters
 to the canvas.
 - Create a dashboard filter control:
- In the Data Panel, click Data and drag an attribute or date column to the new dashboard filters visualization.
- In the Data Panel, click Parameters and drag a parameter to the new dashboard filters visualization.
- Click Properties, then click Filter Controls.
- Expand the filter or parameter you just added.
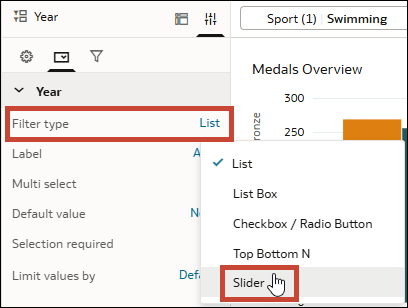
- In the Filter Type row, click the current type and select Slider.
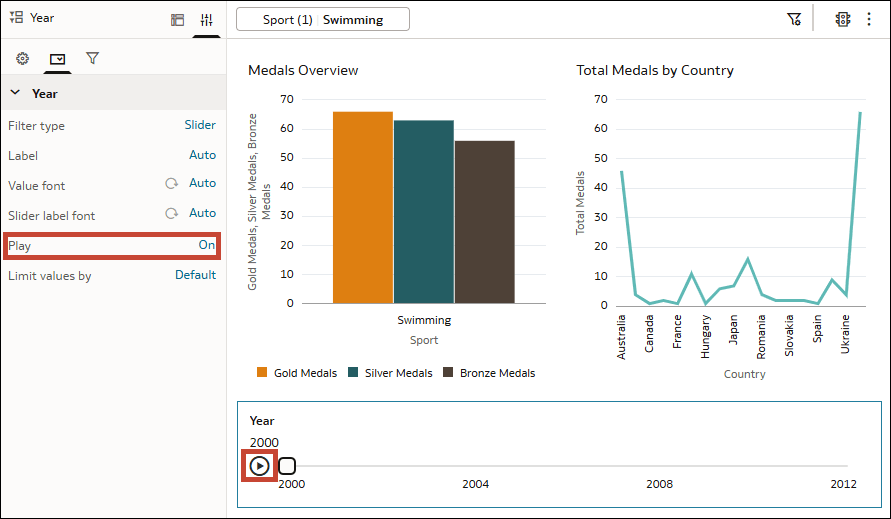
- In the Play row, select On to enable automatic playback or Off to enable consumers to select values manually.
- If you enabled Play, in the dashboard filter visualization, click Play to see how your visualizations change as the filter control moves through the values.