Generate Visualizations from Your Home Page
You can enter questions using natural language or search terms into the search bar on your home page to generate visualizations.
When you ask a question using natural language, the AI Assistant finds and displays the most relevant dashboards and data.
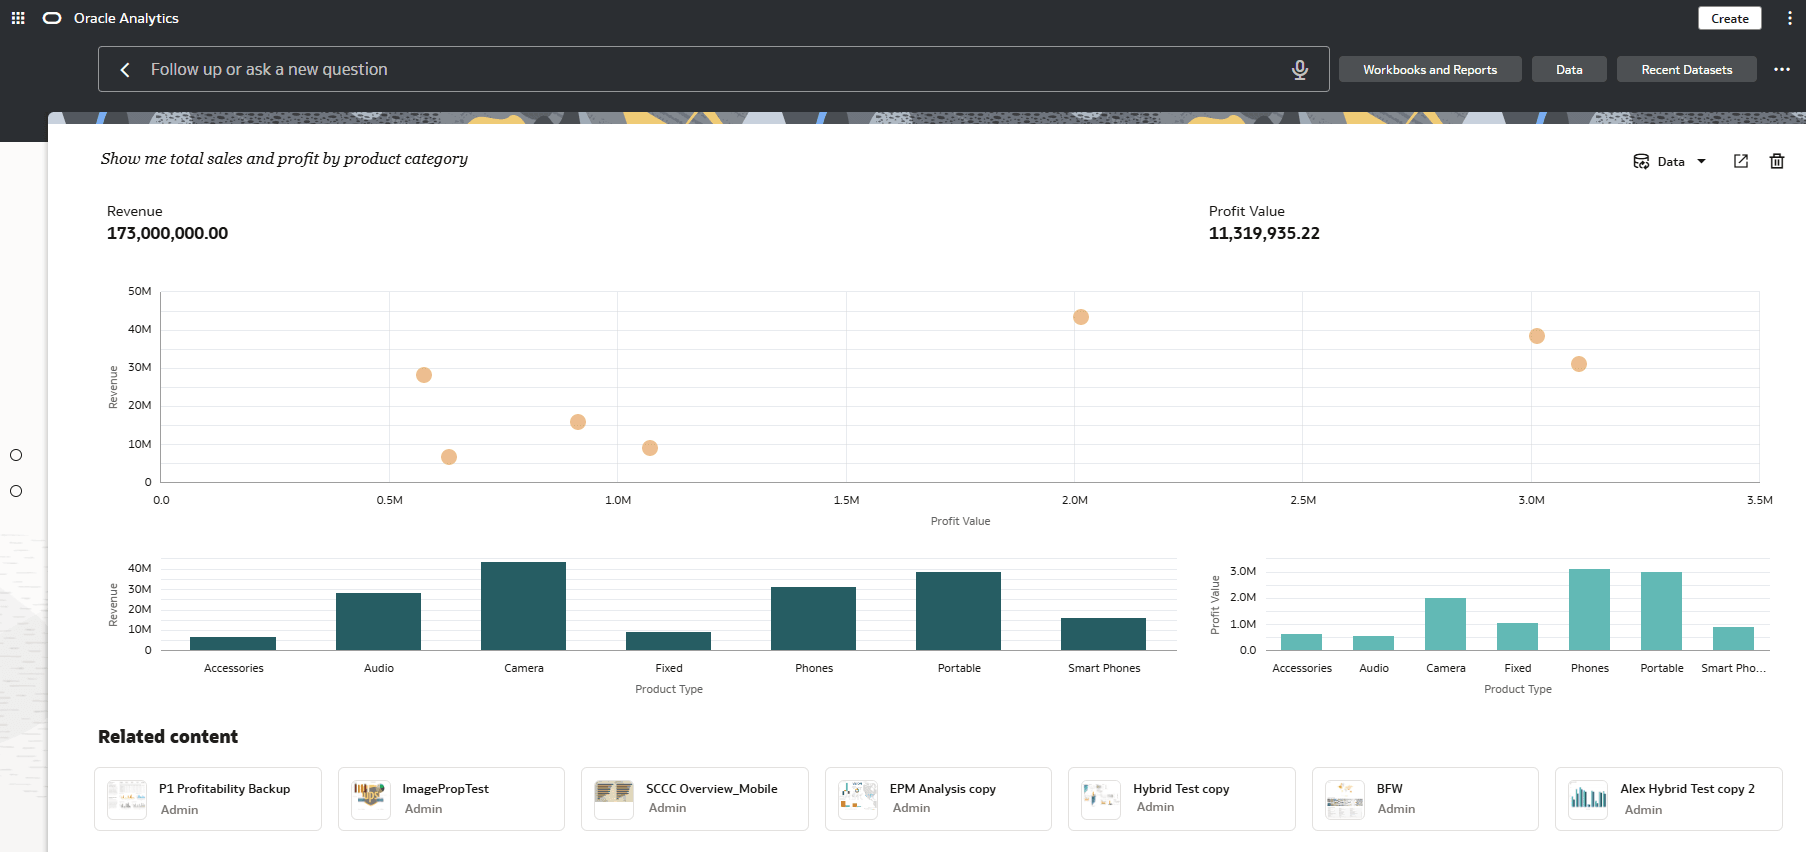
If you want to generate visualization or dashboard to answer a data-related question, type a question and then press Shift+Enter. The AI Assistant will create a dashboard.
The resulting dashboard displays an LLM-created insights summary section, up to five visualizations, and links to related content. You can ask follow-up questions to update visualizations. These dashboards are saved as a thread on the left side of the page so you can quickly toggle between results.
You must index your datasets before you or other users with access to them can use them to build visualizations from your home page. See Index a Dataset.
You can certify datasets to ensure that their contents rank high in search results. See Certify a Dataset.
You can assign synonyms to dataset columns. Use synonyms that are familiar to users to ensure successful searches. See Specify Synonyms for Dataset Columns.
