Let Auto Insights Suggest Visualizations for a Dataset
This topic describes what you need to know to use Auto Insights.
What Are Auto Insights?
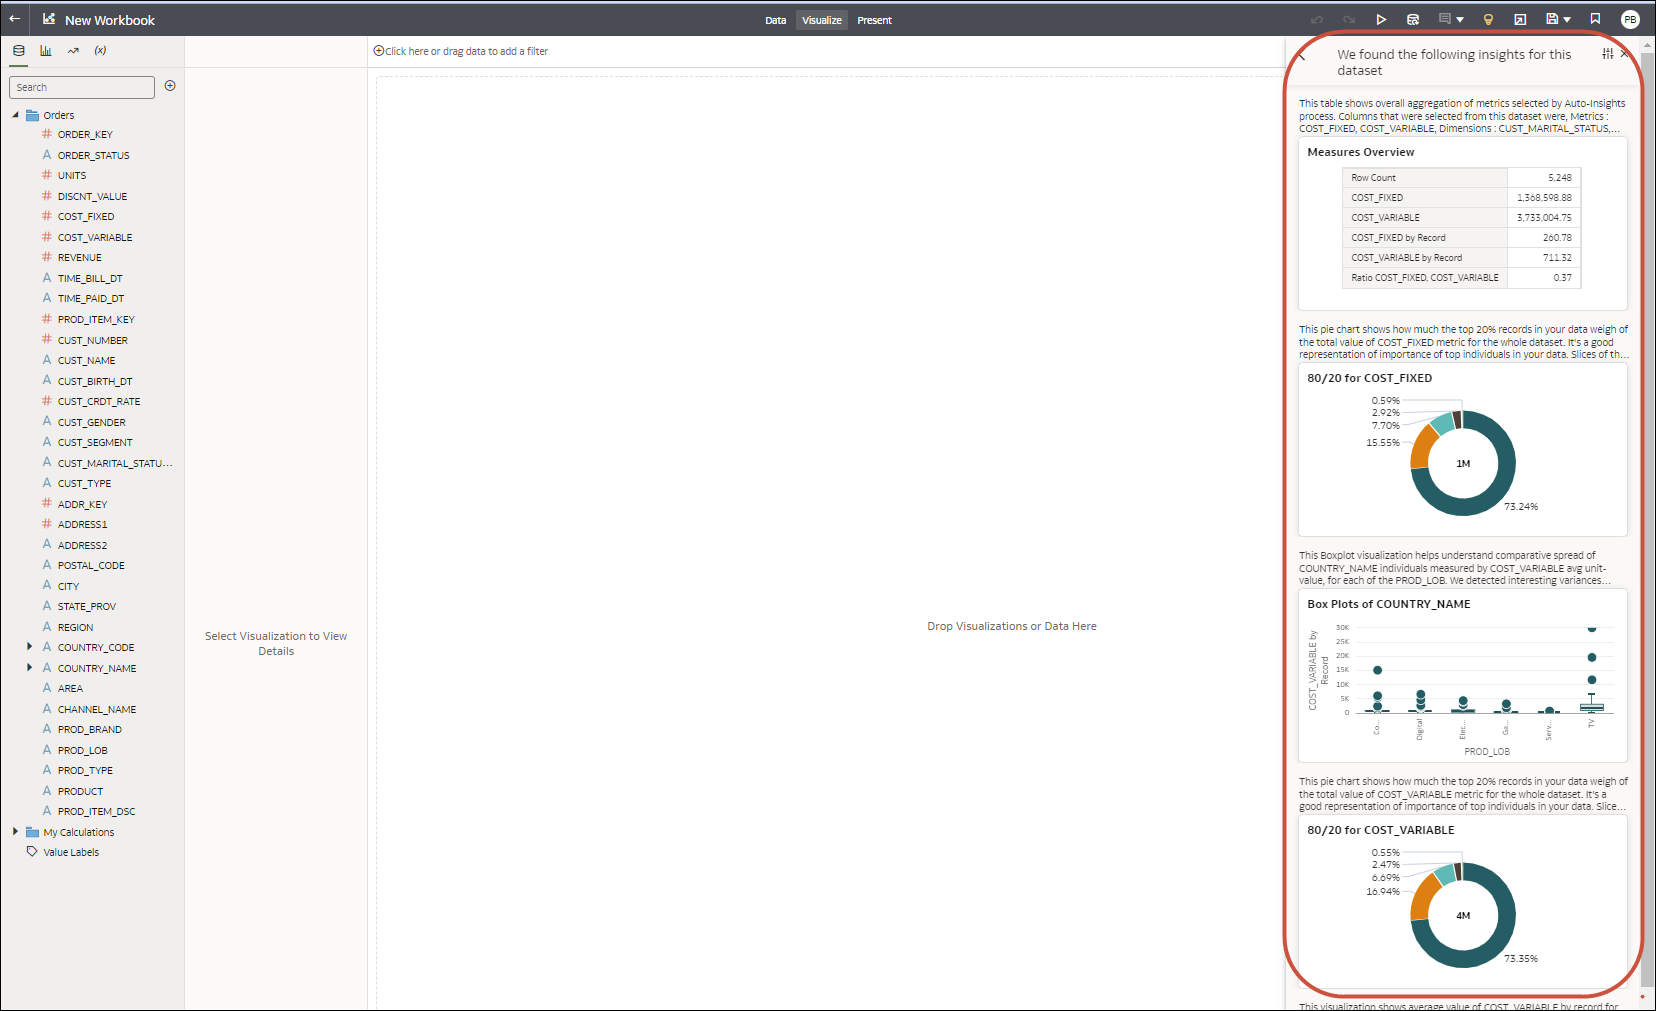
Auto insights are visualizations that Oracle Analytics generates for you based on your dataset's measures, attributes, and relationships. You can add these generated visualizations to your workbook.
The Auto Insights feature does the work of a data scientist for you and helps you understand and analyze your data more completely.
Each auto insight visualization contains a natural language summary
that explains the relationship between attributes and measures, and
highlights other points of interest. 
Description of the illustration insights.png
You can customize the insights results by specifying the dataset columns you want Oracle Analytics to analyze and by specifying the visualization types you want Auto Insights to display.
When you add a dataset to a workbook, Oracle Analytics profiles the dataset to find the insights in your data. After you add a dataset to your workbook, you can open the Auto Insights panel to view the data insights that Oracle Analytics found.
Oracle Analytics generates insights for datasets containing up to 300 million cells, where the number of cells is calculated as the number of rows multiplied by the number of columns.
- Multidimensional sources such as Essbase, Oracle Planning and Budgeting Cloud Service, and Analytic Views.
- Datasets based on non-Oracle databases.
Locate and Choose Visualizations Generated by Auto Insights
Review the visualizations generated by Auto Insights to determine if you want to add any of the insights to your workbook.
When you create or open a workbook, the Auto Insights icon is white while Oracle Analytics reviews the dataset's measures, attributes, and relationships between these data elements to determine insights. The Auto Insights icon turns yellow after Oracle Analytics completes generating insights and displays the suggested visualizations and their summaries.
To generate insights for a dataset, Auto Insights must be enabled for the dataset. See Turn Auto Insights On or Off for a Dataset.
- Create or open a workbook and display the Visualize panel.
- On the toolbar, click Auto Insights
 .
. - In the Auto Insights panel, hover over a visualization that you want to include in the workbook, and click + to add it to the workbook canvas.
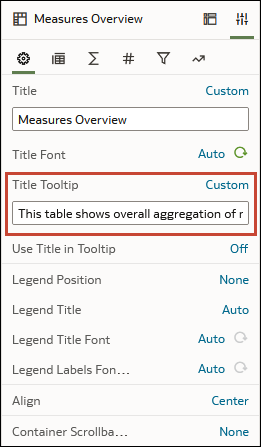
- Optional: In the visualization's Grammar Panel, click Properties,
and in the Title Tooltip field, inspect or update the
visualization's summary.

- Click Save.
Select Which Columns Auto Insights Profiles
You can customize the types of insights that Oracle Analytics generates by selecting data columns to include and exclude from the generated insights. For example, you might exclude data columns that you don't want to analyze.
- Create or open a workbook and display the Visualize panel.
- On the toolbar, click Auto Insights
 .
. - Click Insight Settings
 .
. - In Auto Insight Settings, use the check boxes to select and deselect the columns you want Oracle Analytics to include or exclude in the data profiling.
- Click Apply.
Specify the Visualization Types That Auto Insights Displays
Auto Insights generates a variety of visualizations for a dataset. You can change the default Auto Insights settings to generate specific visualization types.
- Click Auto Insights,
- On the toolbar, click Auto Insights
 .
. - Click Insight Settings
 .
. - In Auto Insight Settings, select or deselect visualization types to include or exclude in Auto Insights.
- Click Apply.
Reset Auto Insights Settings
Oracle Analytics persists the workbook's Auto Insights column and visualization types settings when you close and reopen the workbook. You can revert to the default auto insights settings in a new or saved workbook.
- Create or open a workbook and display the Visualize panel.
- On the toolbar, click Auto Insights
 .
. - Click Insight Settings
 .
. - In Auto Insight Settings, click Reset to default settings to clear your selections and revert to the default auto insights settings.
Turn Auto Insights On or Off for a Dataset
Enable or disable Auto Insights for a dataset to control whether Oracle Analytics suggests visualizations when you add the dataset to a workbook. For example, you might turn off insights for a dataset if performance is impaired.
- On the Home page, click Navigator, then Data, then Datasets.
- Click Actions for a Dataset, and select Inspect.
- On the General tab, select Enable Insights.
- Click Save.