What Is Explain?
In Oracle Analytics, Explain provides advanced insights about any specific column or calculation that you select from your dataset. Explain analyzes data from the selected column (target column) in relation to other columns in the dataset and generates specific types of insights about it.

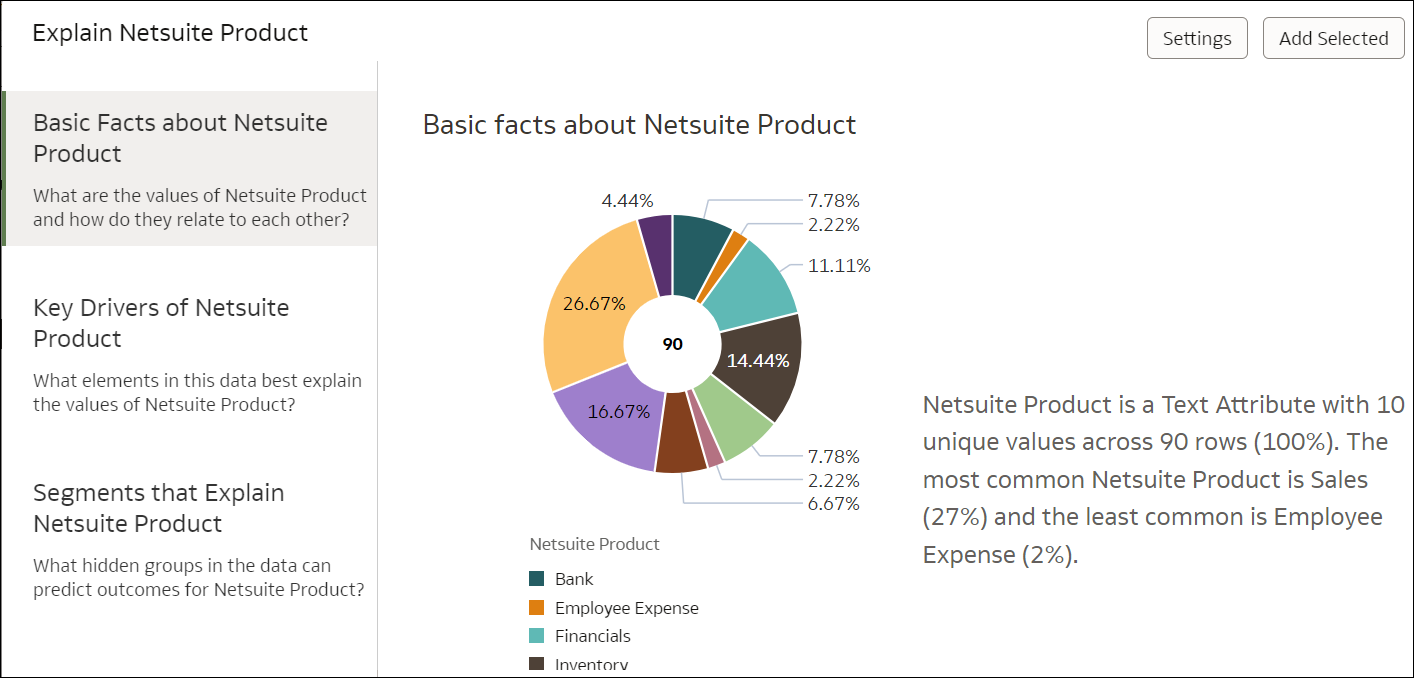
Description of the illustration explain-basic-facts.png
- Basic facts: shows a visualization and series of descriptive statistics about the selected column.
- Key Drivers: shows which other columns in the rest of the dataset are the most significant drivers of the selected column.
- Segments: shows whether there are segments of records in the whole dataset that show a particular unusual distribution for the selected column.
- Anomalies: shows intersections in the dataset that behave differently than expected.
You can use Explain to identify correlations or interesting segments in the data and quickly understand a new dataset. Explain uses statistics and machine learning algorithms to generate fast and powerful insights about your data. It then creates corresponding visualizations to present insights, each of which you can add to your workbook's canvas using a single click. Explain is a very useful starting point for data analysts to dive into the details for a specific column in their data, or confirm an expected behavior or relationship between various columns in the data.