Quick Start with Explain
In the Oracle Analytics workbook designer, right-click a target column in the Data Panel and select Explain <column name>. Oracle Analytics analyzes that column against various other columns available in the dataset (contributing columns) and generates insights.
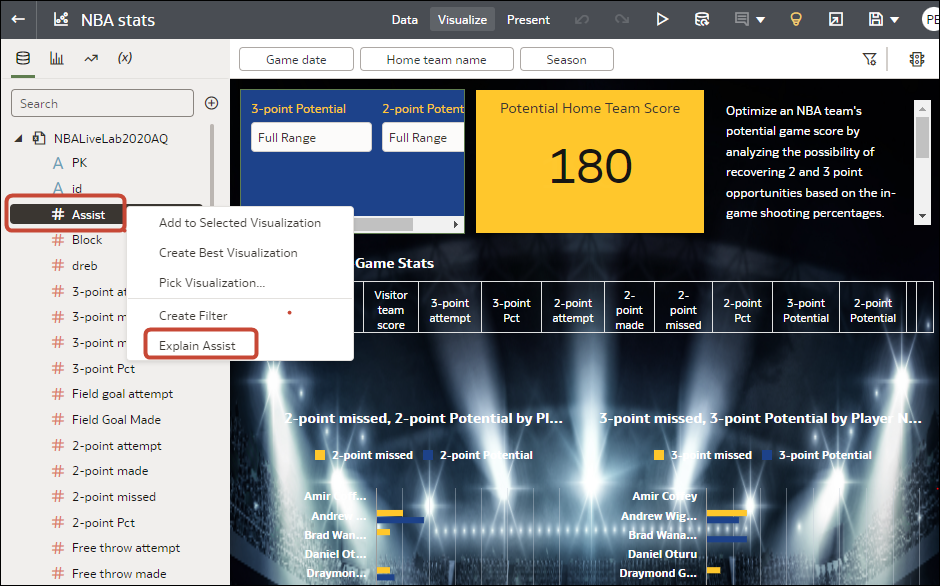
Description of the illustration explain.png
You can also generate insights for calculations or group calculations that are based on at least one column.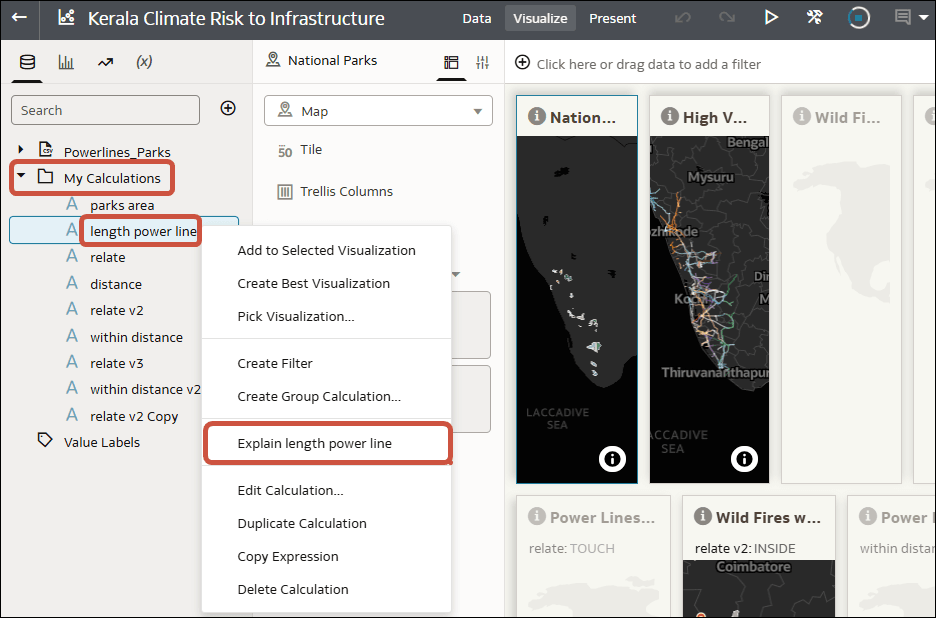
Description of the illustration explain-workbook-calculations.png
Using Explain with Columns
Explain works with any target column of the attribute type or measure type in your dataset (except dates and times). When you run Explain on a target column of the metric type, the results you get depend on the aggregation rule set for this target measure column. If your target measure has an average aggregation rule, Explain computes Key Drivers on that column, but not if you're running Explain on a Sum column.
Using Explain with Calculations
Explain works with most column-based calculation or group calculation listed in the My Calculations folder associated with a dataset. There are some limitations depending on the type of functions used and the complexity of the calculations. Right-click a calculation in the My Calculations area of the Data Panel and select Explain <calculation name>.
Interact with Explain
Once the Explain panel is displayed, algorithms automatically identify the most interesting columns from your dataset to use for explaining your target column. It's possible that not all columns from your data are being used. You can also add or remove columns by clicking Settings to change the settings.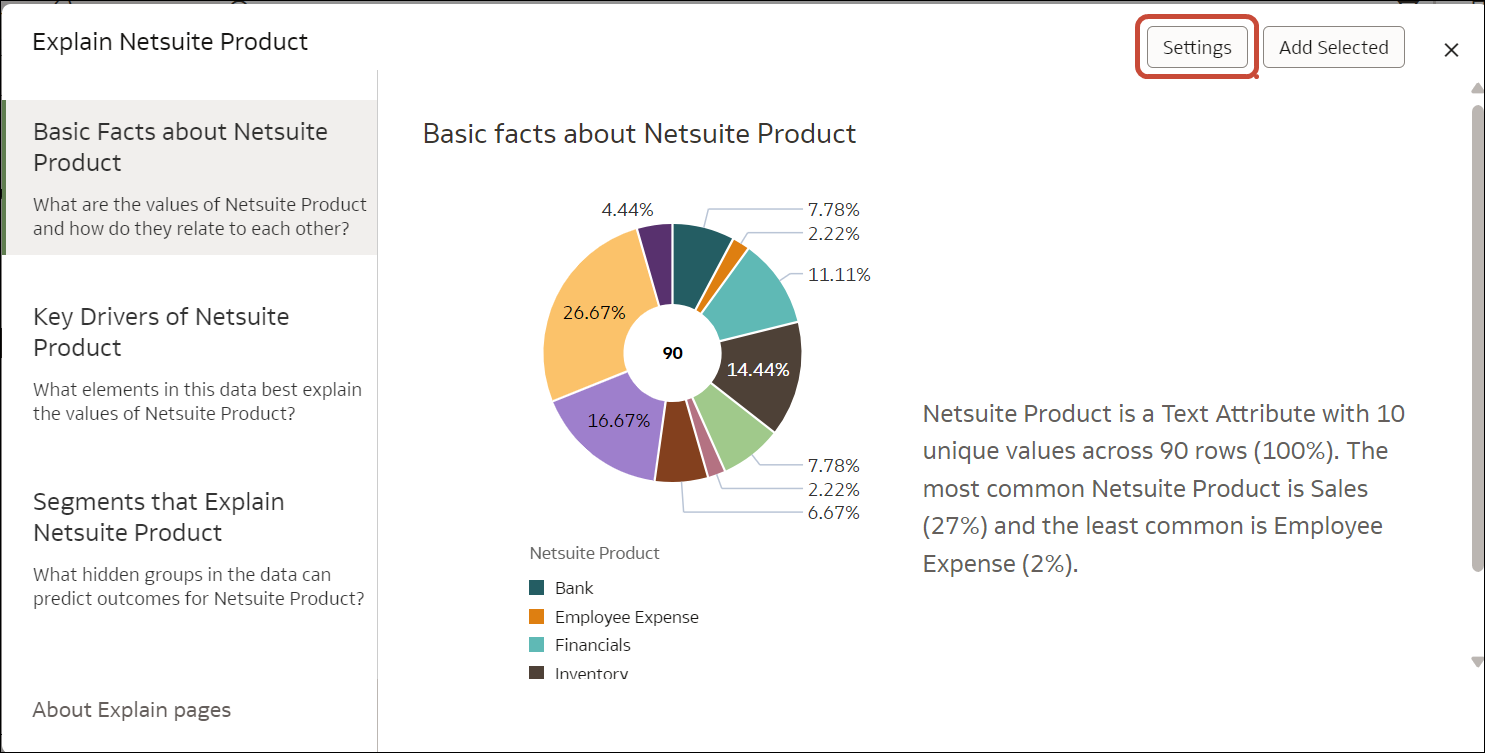
Description of the illustration explain-settings-option.png
In the Settings dialog, expand the dataset folder and select the columns you want Explain to use when analyzing your target column.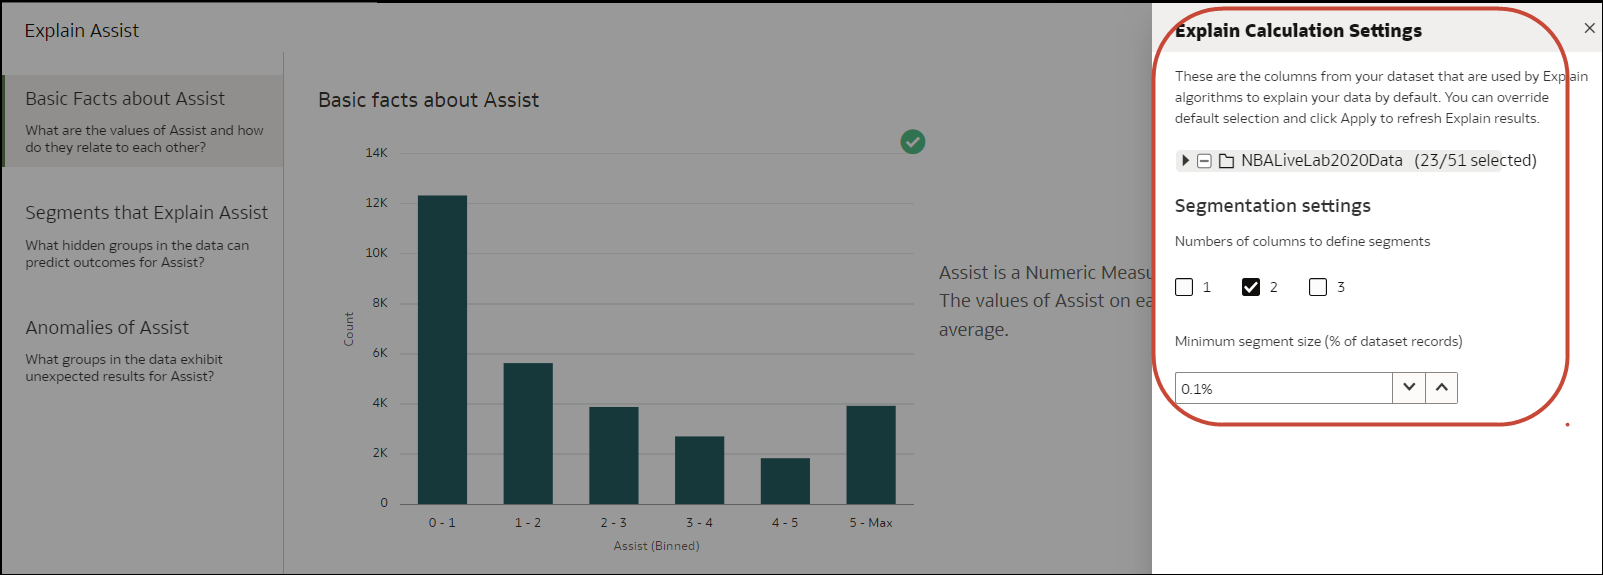
Description of the illustration explain-settings.png
As you browse visualizations on a tab, you can highlight the check mark by hovering over the top right of each data visualization. This icon lets you select the ones you want to add to your own canvas. Once done, click Add Selected at the top right of the window to automatically add the selected visualizations to your canvas. 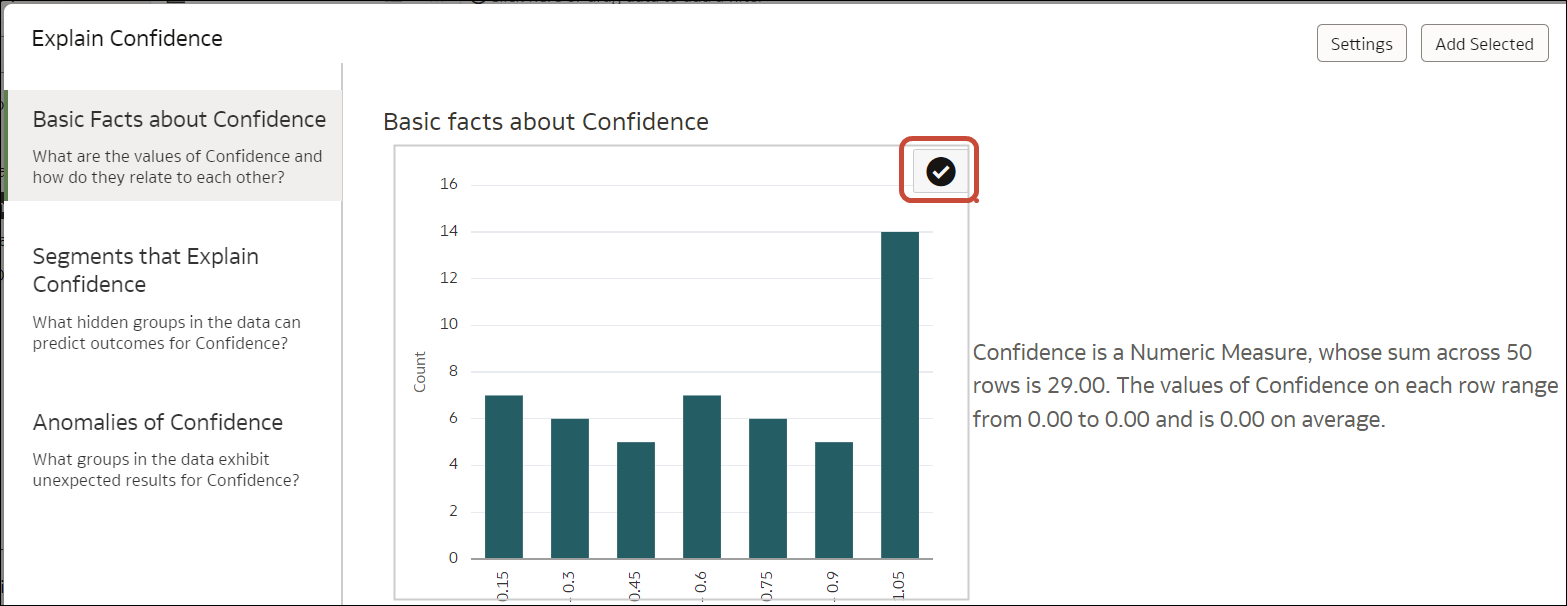
Description of the illustration explain-add-insight.png
Supported Dataset Types and Known Limitations
- Multidimensional sources such as Essbase, Oracle Planning and Budgeting Cloud Service, and Analytic Views
- Subject Areas or Local Subject Areas
You can use multi-table datasets if you set the Preserve Grain option on the Fact Table in the model. Setting this option indicates which table acts as the fact table when multiple tables are joined in a model. Set the Preserve Grain option by right-clicking the table in the data model. If you're using a multi-table dataset with the Preserve Grain option on, Explain considers the entire data model to explain the target column you have selected. If the Preserve Grain option is not set, Explain only considers the table that the target column you've clicked belongs to.
If you have a dataset of an unsupported type, you can generate an extract of these datasets and create a file-based or table-based dataset in Oracle Analytics, then run Explain on them.
Explain displays text descriptions of the results in English.