View Activity Stream Logs in Oracle Log Analytics
Publish human in the loop activity stream logs to Oracle Log Analytics to view them beyond the standard retention period in Oracle Cloud Console. Oracle Log Analytics provides long-term log retention for auditing and compliance, along with dashboards that help you analyze workflow and task instances, identify trends, and troubleshoot issues.
About Activity Stream Logs Published to Oracle Log Analytics
Activity stream logs are generated and published to Oracle Log Analytics for the following state changes of workflow and its components.
- Workflow: Created, Completed, Faulted, Expired
- Start Event: Created, Completed
- Task: Created, Unassigned, Assigned, Withdrawn, Completed
- End Event: Created, Completed
- If Else: Created, Completed
Activity stream logs are published in JSON format to Oracle Log Analytics. The predefined parser for human in the loop activity stream logs is used to parse the JSON log source file into log entries, and then parse those log entries into Oracle Log Analytics fields. The table below gives the mapping between JSON field names and the Log Analytics field names.
| JSON Field | Log Analytics Field | Data Type | Description |
|---|---|---|---|
| time | Time | TimeStamp | Time stamp at which the log record was captured in human in the loop activity stream. |
| processDefinitionId | Definition | String | Unique identifier (GUID) of the deployed workflow. |
| processDefinitionName | Process Name | String | Name of the workflow. |
| processDefinitionKey | Key | String | Key identifier of the corresponding workflow which is in the format <OICProjectID>--<WorkflowVersion>--<WorkflowName> |
| processDefinitionVersion | Version | String | Workflow version |
| processInstanceState | Process State | String | State of the workflow record. |
| processInstanceId | Instance | String | Unique identifier (GUID) of the specific running or completed workflow instance. |
| activityType | Event Type | String | Type of workflow activity being executed (for example, task, start event, end event, and so on) |
| activityInstanceState | Event State | String | Current state of the activity instance (For example, Created, Assigned, Completed, and so on). |
| startTime | Start Time | TimeStamp | Date and time when the activity instance began execution. |
| endTime | End Time | TimeStamp | Date and time when the activity instance completed. |
| activityInstanceId | Event Instance ID | String | Unique identifier (GUID) of the specific execution instance of a workflow activity. |
| activityId | Event ID | String | Unique identifier (GUID) of the activity as defined in the workflow model. |
| activityName | Event | String | Name of the workflow activity. |
| userTaskOutputPayload.taskExec.approverDisplayName | Approver | String | Display name of the user who approved or acted on the task. |
| userTaskOutputPayload.taskExec.approver | Approver ID | String | ID of the user who approved or acted on the task. |
| assigneeName | Assignee | String | Display name of the user or group currently assigned to the task. |
| assigneeId | Assignee ID | String | Unique identifier of the user or group assigned to the task. |
| assigneeType | Assignee Type | String | Type of assignee, such as User or Group. |
| taskId | Task ID | String | Unique identifier of the task instance. |
| oicProjectId | Project ID | String | Unique identifier of the Oracle Integration project containing the workflow. |
| updatedTime | Update Time | TimeStamp | Date and time when the task or activity was last updated. |
| candidateUsersAndGroups.[*].name | User Names | String, Multi-valued | Names of a users or groups who can claim and take action on the task. |
| processInstanceDuration | Duration | Float | The total time taken by the process instance from start to completion. |
| activityInstanceDuration | Event Duration | Float | Total time taken by the activity instance. |
| taskOutcome | Result | String | Final outcome of the task (for example, Approve, Reject or Submit). |
| faultCode | Error ID | String | Error or fault code associated with the activity or task execution, if any. |
| taskSubtype | SubType | String | Subtype or classification of the task. |
| activityInstanceSubState | Sub Status code | String | More detailed status of the activity instance. |
| userTaskOutputPayload.taskExec.approverComment | Comment | String | Comments provided by the approver while completing the task. |
| candidateUsersAndGroups[*].type | User Types | String, Multi-valued | Types of candidate assignee, such as Users and Groups. |
| deploymentId | Deployment ID | String | Unique identifier (GUID) of the deployed workflow corresponding to the activation. |
| serviceInstanceOCID | OCI Resource OCID | String | Oracle Cloud Identifier (OCID) of the service instance where the workflow is deployed. |
| dueDate | Due Date | TimeStamp | The target deadline for completion of the task. |
| taskPriority | Task Priority | String | A task configuration that lets user's rank human tasks to help them organize and sort their work lists. |
View Logs
Use the Log Explorer in Log Analytics to view and inspect activity stream logs, examine parsed log fields, select a time range, and create custom queries to filter and analyze log records.
- From the navigation menu, select Observability & Management, and then under Log Analytics select Log Explorer.
The Log Explorer page (with the default query) opens.
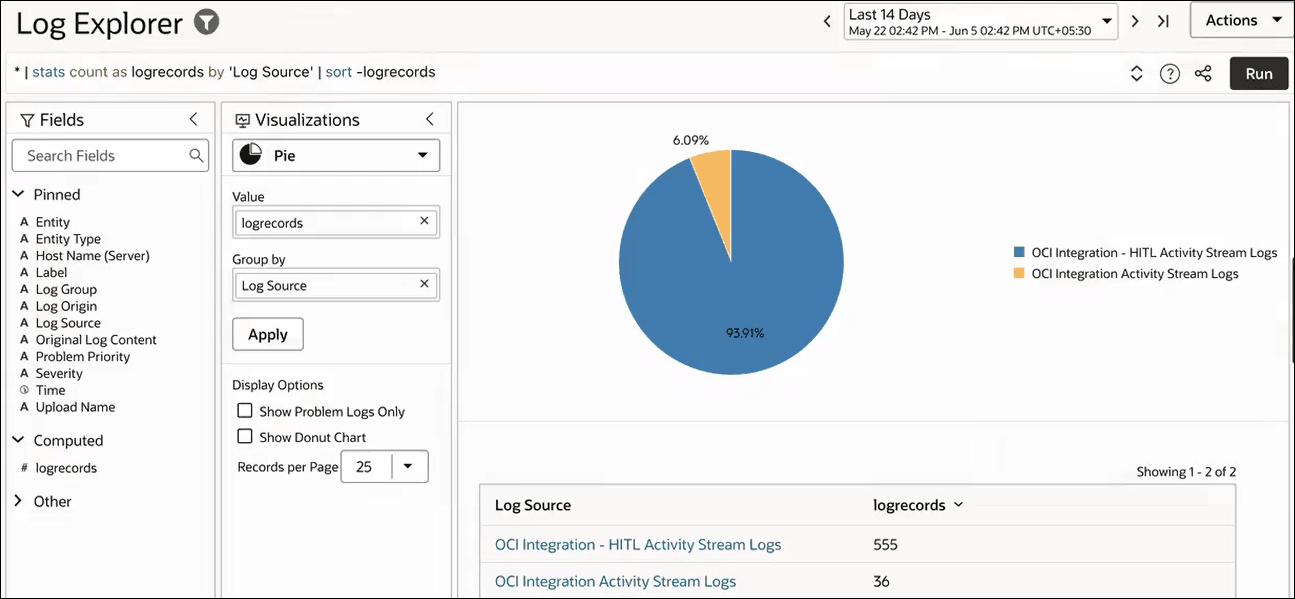
The visualization type, log source, and total count of log records are displayed on the main pane.
View Dashboards
Use the Oracle Integration HITL dashboard in Log Analytics to monitor workflow instances and tasks, including their statuses, completion time, and outcomes.
- Select a time period from the drop-down list, or specify a custom time range for the dashboard visualizations.
A dashboard listing five widgets with different visualizations for workflow instances appears.
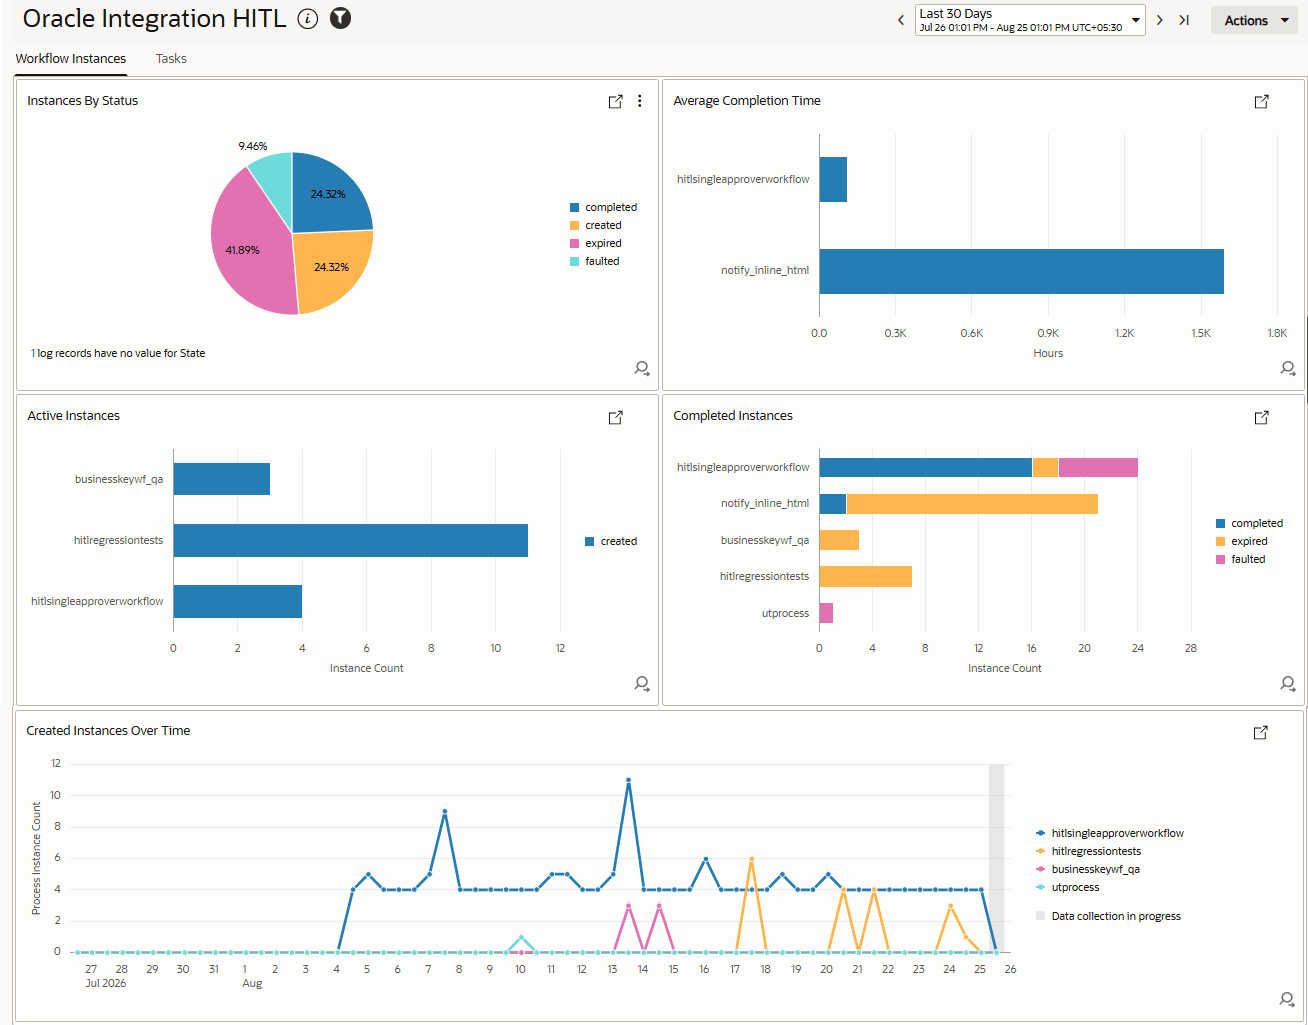
Name Description Instances By Status Pie chart that shows the number of workflow instances in various runtime statuses such as completed, created, expired, and faulted. Average Completion Time Bar graph that shows the average time in hours that workflow instances took to complete. Each horizontal bar represents a workflow and the X-axis is hours. Active Instances Bar graph that shows the number of instances in the created state. Completed Instances Bar graph that shows the number of completed workflow instances. This includes instances that have completed, expired, and faulted. Created Instances Over Time Time-series chart that plots count of instances created by date and workflow. - Select the Tasks tab.
A dashboard listing five widgets with different visualizations of task instances appears.
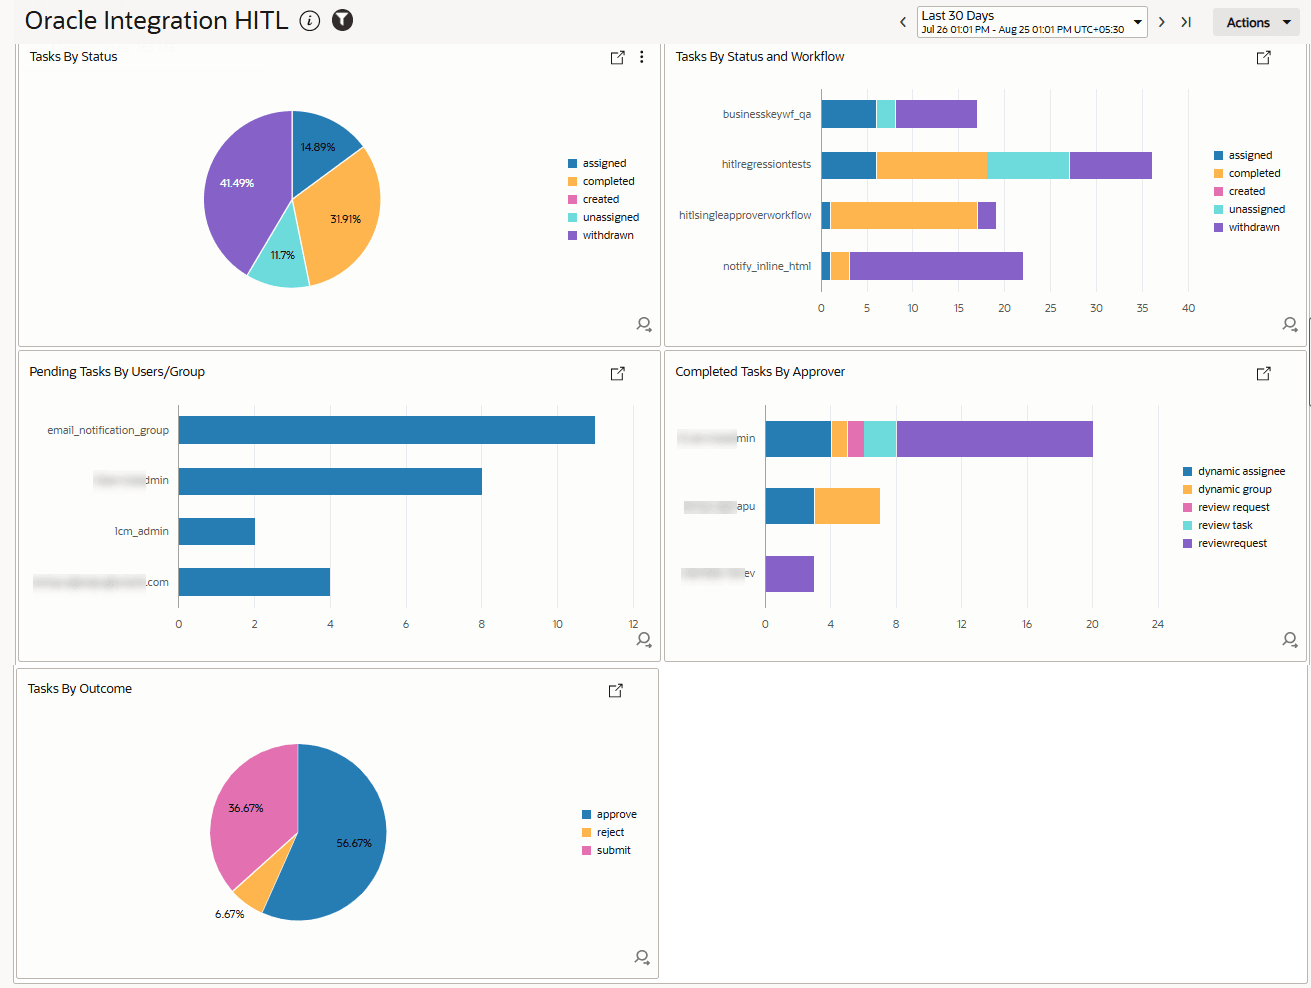
Name Description Tasks By Status Pie chart that shows the number of task instances in various statuses such as assigned, completed, created, unassigned, and withdrawn. Tasks By Status and Workflow Bar graph that shows statuses of tasks for each workflow. Each horizontal stacked bar represents a workflow. The colors show how many tasks are assigned, completed, created, unassigned, or withdrawn. Pending Tasks By Users/Group Bar graph that shows number of pending tasks currently associated with individual users or groups. Completed Tasks By Approver Bar graph that shows completed tasks associated with each approver, broken down by task type. Each bar represents an approver, while the colors represent task types such as dynamic assignee, dynamic group, review request, review task, and reviewrequest. Tasks By Outcome Pie chart that shows the count of approve, reject, and submit task outcomes.