Check an Integration's Tracing Level

To ensure that your integrations are capturing the minimum required tracing information, consider routinely checking their tracing levels. For instance, Oracle recommends not using the Debug tracing level in production.
  1. In the navigation pane, click Observability, then Dashboards.
  2. Below the Instance status heading, select the appropriate time period to review from the drop-down.

    For instance, you might want to check the tracing levels for the last 24 hours or week.

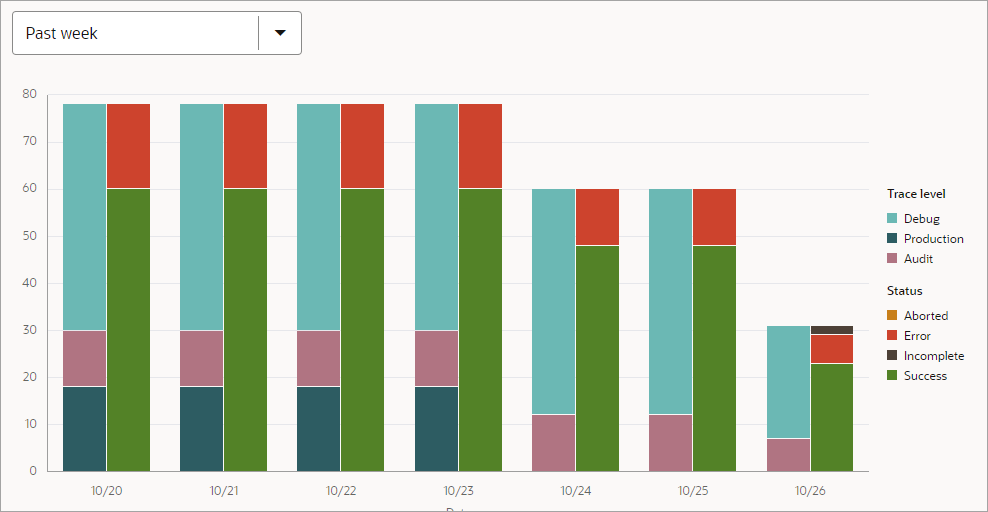
  3. Familiarize yourself with the chart that appears below Instance status.

    The bar chart shows 7 days of information, with varying measurements for each day.

    • Each time period contains two vertical bars.
    • The left bar visualizes the tracing levels for the integrations that ran during the time period.
    • The right bar visualizes the statuses for the integrations that ran during the time period.
  4. Check the tracing levels for your integration instances for the time period.