See the Current Status of All Integration Components

Get at-a-glance information about the number and status of your projects, integrations, connections, and more. For example, learn how many REST connections your organization has created.

This information can be helpful for showing your team's contributions, such as when you're compiling year-end metrics for the work that you've delivered.
  1. In the navigation pane, click Observability, then Dashboards.
  2. Along the top, select the Design time and audit box.

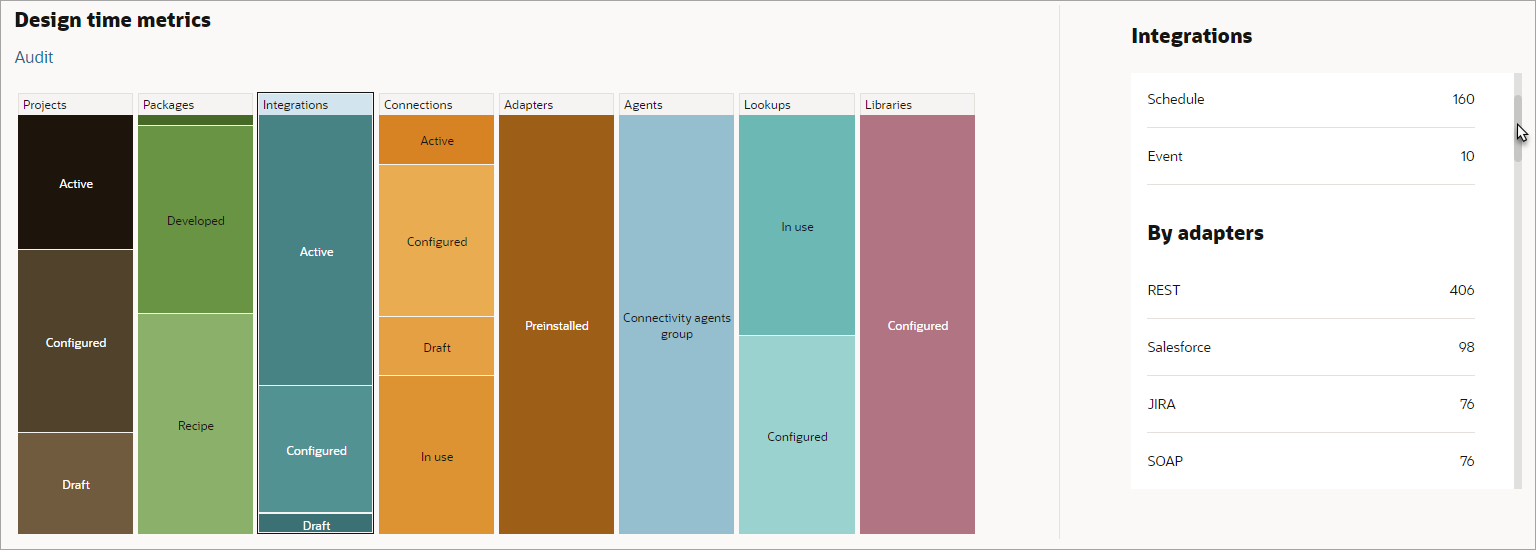
    The Design time metrics heading appears. A chart visualizes the components in your Oracle Integration instance.

  3. Obtain metrics using one or both of the following options:
    • Below the Design time metrics heading, point to an entry in the chart, and view a metric in the tooltip that appears.

    • On the right, below the Integrations heading, obtain additional metrics.

      Tip:

      The table of metrics on the right often contains more information than can fit on the page. Point within the table of metrics to see a scroll bar, and scroll down to see additional metrics.

    The Design time metrics page shows metrics for your instance