Measure Your Integration Errors Over Time
Measuring your integration errors over time can help you track trends and measuring improvements.
- In the navigation pane, click Observability, then Dashboards.
- Below the Instance status header, use the drop-down to adjust the time period, if necessary.
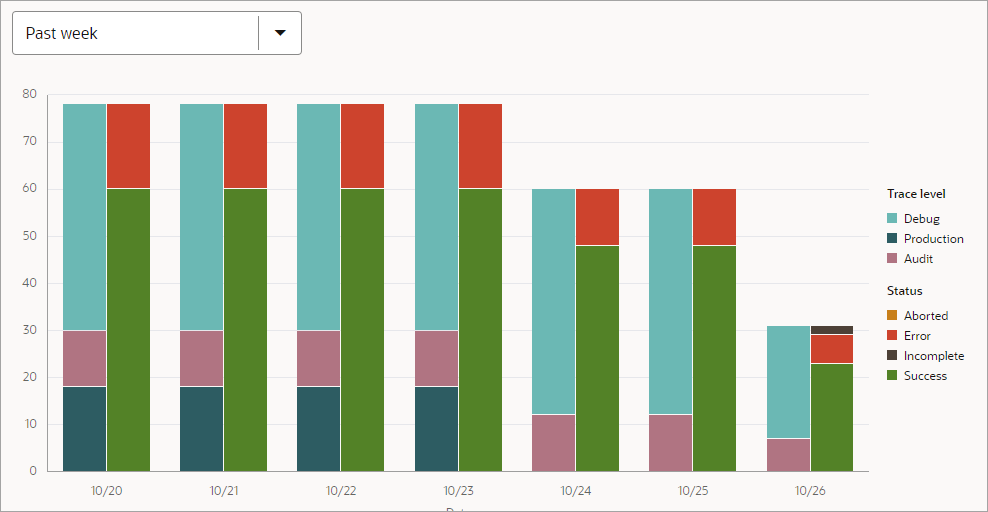
- Review a chart to visually track your errored integrations over time.
- Familiarize yourself with the chart that appears below Instance
status.

- Each time period contains two vertical bars.
- The left bar visualizes the tracing levels for the integrations that ran during the time period.
- The right bar visualizes the statuses for the integrations that ran during the time period.
- Determine whether any integration instances experienced errors during the time period.
- Familiarize yourself with the chart that appears below Instance
status.
- Review the metrics to understand how many integration instances have
experienced errors over time.
The error-related metrics appear to the right of the chart, below the Overview heading.
- Error rate: Error rate for all of the integration instances during the time period.
- Instances: Number of integration instances that ran during the time period.
- Errors: Number of integration instances with a state of Errored during the time period.