How Do I Monitor Billing for Multiple Instances?
Monitor your billing and usage for your instance fleet in the Oracle Cloud Console on the billing and cost management pages.
Options for monitoring your instance fleet
You have the following options for monitoring billing across your instance fleet:
-
View details on the billing and cost management pages. Keep reading for details.
-
Push billing data to Oracle Log Analytics.
To monitor billing for your instance fleet:
-
Find out how many message packs were selected for each instance. See How Do I View the Message Packs for an Instance?.
-
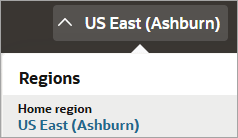
In the Oracle Cloud Console, make sure your home region is selected in the region drop-down.
-
Open the navigation menu and select Billing & Cost Management. Then, below Cost Management, select Cost Analysis.
-
From the Reports drop-down, select Costs by Service.
-
Update the filters for the page:
-
Start date and End date: Select a period of time.
-
To understand your usage over time, start with a large time range, such as 30 or 90 days.
-
If you saw a spike for a specific day and want to understand what happened, narrow the time window to a one-day period.
-
-
Granularity: Select Daily.
-
Show: Select Cost. This option shows the amount that you've been billed for.
-
Filters: To show only data for Oracle Integration, select Service, and then select INTEGRATION_CLOUD from the drop-down.
-
Grouping dimensions: To view a chart that breaks down usage by instance, select Resource OCID. For optimal readability, combine this grouping with the Service filter so that the chart displays instances for a single service.
-
-
Select Apply.
The charts are updated according to your filters.
-
Review the chart:
-
The Cost by Date chart shows your daily billing amount. If you didn't filter by a specific service name, the legend on the right helps you understand the breakdown by service.
-
The Details table below the chart shows the cost details for each service on each day.
-
-
If your daily billing amount varies, the instance probably consumed more messages than its configured message packs.
To learn more about billing, see the other FAQs at FAQs for Billing.
To monitor usage for your instance fleet:
These steps continue from the previous procedure.
-
From the Show drop-down, select Usage, and then select Apply.
The Usage by Date chart appears, displaying usage metrics for each service instance.
-
In the chart, find the number of message packs that an instance used on a given day, and divide it by 24.
The result is the number of message packs the instance used that day. To identify overages, you must know the number of configured message packs.
Examples: Usage without overages
-
24: The instance was configured for 1 message pack and used 1 message pack per hour:
24 message packs / 24 hours = 1 message pack per hour -
48: The instance was configured for 2 message packs and used 2 message packs per hour:
48 message packs / 24 hours = 2 message packs per hour
Examples: Usage with overages
-
26: The instance was configured for 1 message pack and used 1 message pack per hour plus 2 additional message packs:
26 message packs / 24 hours = 1 message pack per hour + 2 additional message packs -
38: The instance was configured for 1 message pack and used 1 message pack per hour plus 14 additional message packs:
38 message packs / 24 hours = 1 message pack per hour + 14 additional message packs
-