Monitor Performance with Autonomous AI Database Metrics
You can monitor the health, capacity, and performance of your databases with metrics, alarms, and notifications. You can use Oracle Cloud Infrastructure Console or Monitoring APIs to view metrics.
- View Metrics for an Autonomous AI Database Instance
Shows the steps to view the Autonomous AI Database metrics. - View Metrics for Autonomous AI Databases in a Compartment
Shows the steps to view metrics for Autonomous AI Databases in a compartment. - Autonomous AI Database Metrics and Dimensions
You can limit the instances where you see metrics with dimensions. The available dimensions include: workload type, instance display name, region, and the instance OCID. - Use Custom Metrics on Autonomous AI Database
Describes how to create and publish custom metrics on Autonomous AI Database.
Parent topic: Monitor and Manage Performance
View Metrics for an Autonomous AI Database Instance
Shows the steps to view the Autonomous AI Database metrics.
To view metrics you must have the required access as specified in an Oracle Cloud Infrastructure policy (whether you're using the Console, the REST API, or another tool). See Getting Started with Policies for information on policies.
Perform the following steps as necessary:
-
Open the Oracle Cloud Infrastructure Console by clicking the
 next to Cloud.
- From the Oracle Cloud Infrastructure left navigation menu click Oracle Database and then click Autonomous AI Database.
-
On the Autonomous AI Databases page select an Autonomous AI Database from the links under the Display name column.
To view metrics for an Autonomous AI Database instance:
- On the Autonomous AI Database Details page, select the Monitoring tab.
- There is a chart for each metric. In each chart you can select the Interval and Statistic or use the default values.
Note:
The following table shows the default metrics shown on the Oracle Cloud Infrastructure Console Monitoring tab.See Available Metrics: oci_autonomous_database for a list of all the database metrics and dimensions.
| Metric Name | Description |
|---|---|
|
CPU utilization |
CPU utilization expressed as a percentage, aggregated across all consumer groups. The utilization percentage is reported with respect to the number of CPUs the database is allowed to use, which is the number of ECPUs. If your database uses OCPUs, the number of CPUs allowed is two times the number of OCPUs. |
|
Storage utilization |
The percentage of provisioned storage capacity currently in use. Represents the total allocated space for all tablespaces. |
|
Sessions |
The number of sessions in the database. |
|
Execute count |
The number of user and recursive calls that ran SQL statements during the selected interval. |
|
Running statements |
The number of running SQL statements, aggregated across all consumer groups, during the selected interval. |
|
Queued statements |
The number of queued SQL statements, aggregated across all consumer groups, during the selected interval. |
|
Database availability |
The database is available for connections during the selected time interval (data for this metric lags by 5 minutes). Possible values for this metric:
You can set an alarm that is triggered if the database is not available (value 0). Note: Availability is calculated using failed connections due toORA-12514 errors, based on the “Monthly Uptime Percentage” described in the Oracle PaaS and IaaS Public Cloud Services Pillar Document document under Delivery Policies (see Autonomous Database Availability Service Level Agreement).
|
|
Failed connections |
Shows the total number of failed connections to the database during the selected interval. A connection is counted as failed when a connection attempt
reaches the database and logs any of the following errors:
|
To create an alarm on a metric, in a metric chart or table, select
![]() and in the menu select Create an alarm on this
query. See Managing Alarms for
information on setting and using alarms.
and in the menu select Create an alarm on this
query. See Managing Alarms for
information on setting and using alarms.
For more information about metrics see Available Metrics: oci_autonomous_database.
You can also use the Monitoring API to view metrics. See Monitoring API for more information.
- View Logs and Audit Trails
Shows the steps to view the Autonomous AI Database logs and audit trails.
Parent topic: Monitor Performance with Autonomous AI Database Metrics
View Logs and Audit Trails
Shows the steps to view the Autonomous AI Database logs and audit trails.
Note:
To view logs and audit trials you must have the required access as specified in an Oracle Cloud Infrastructure policy (whether you're using the Console, the REST API, or another tool). See Getting Started with Policies for information on policies.To view audit trails and logs for an Autonomous AI Database instance:
- On the Details page, select the Monitoring tab.
- On the Monitoring tab, click the view audit and logs
link.
-
In the Logging area, click Logs to view log information.
-
In the logging area, click Audit to view audit information.
-
See Audit Autonomous AI Database and Audit Logs for more information.
Parent topic: View Metrics for an Autonomous AI Database Instance
View Metrics for Autonomous AI Databases in a Compartment
Shows the steps to view metrics for Autonomous AI Databases in a compartment.
To view metrics you must have the required access as specified in an Oracle Cloud Infrastructure policy (whether you're using the Console, the REST API, or other tool). See Getting Started with Policies for information on policies.
-
Open the Oracle Cloud Infrastructure Console by clicking the
 next to Cloud.
-
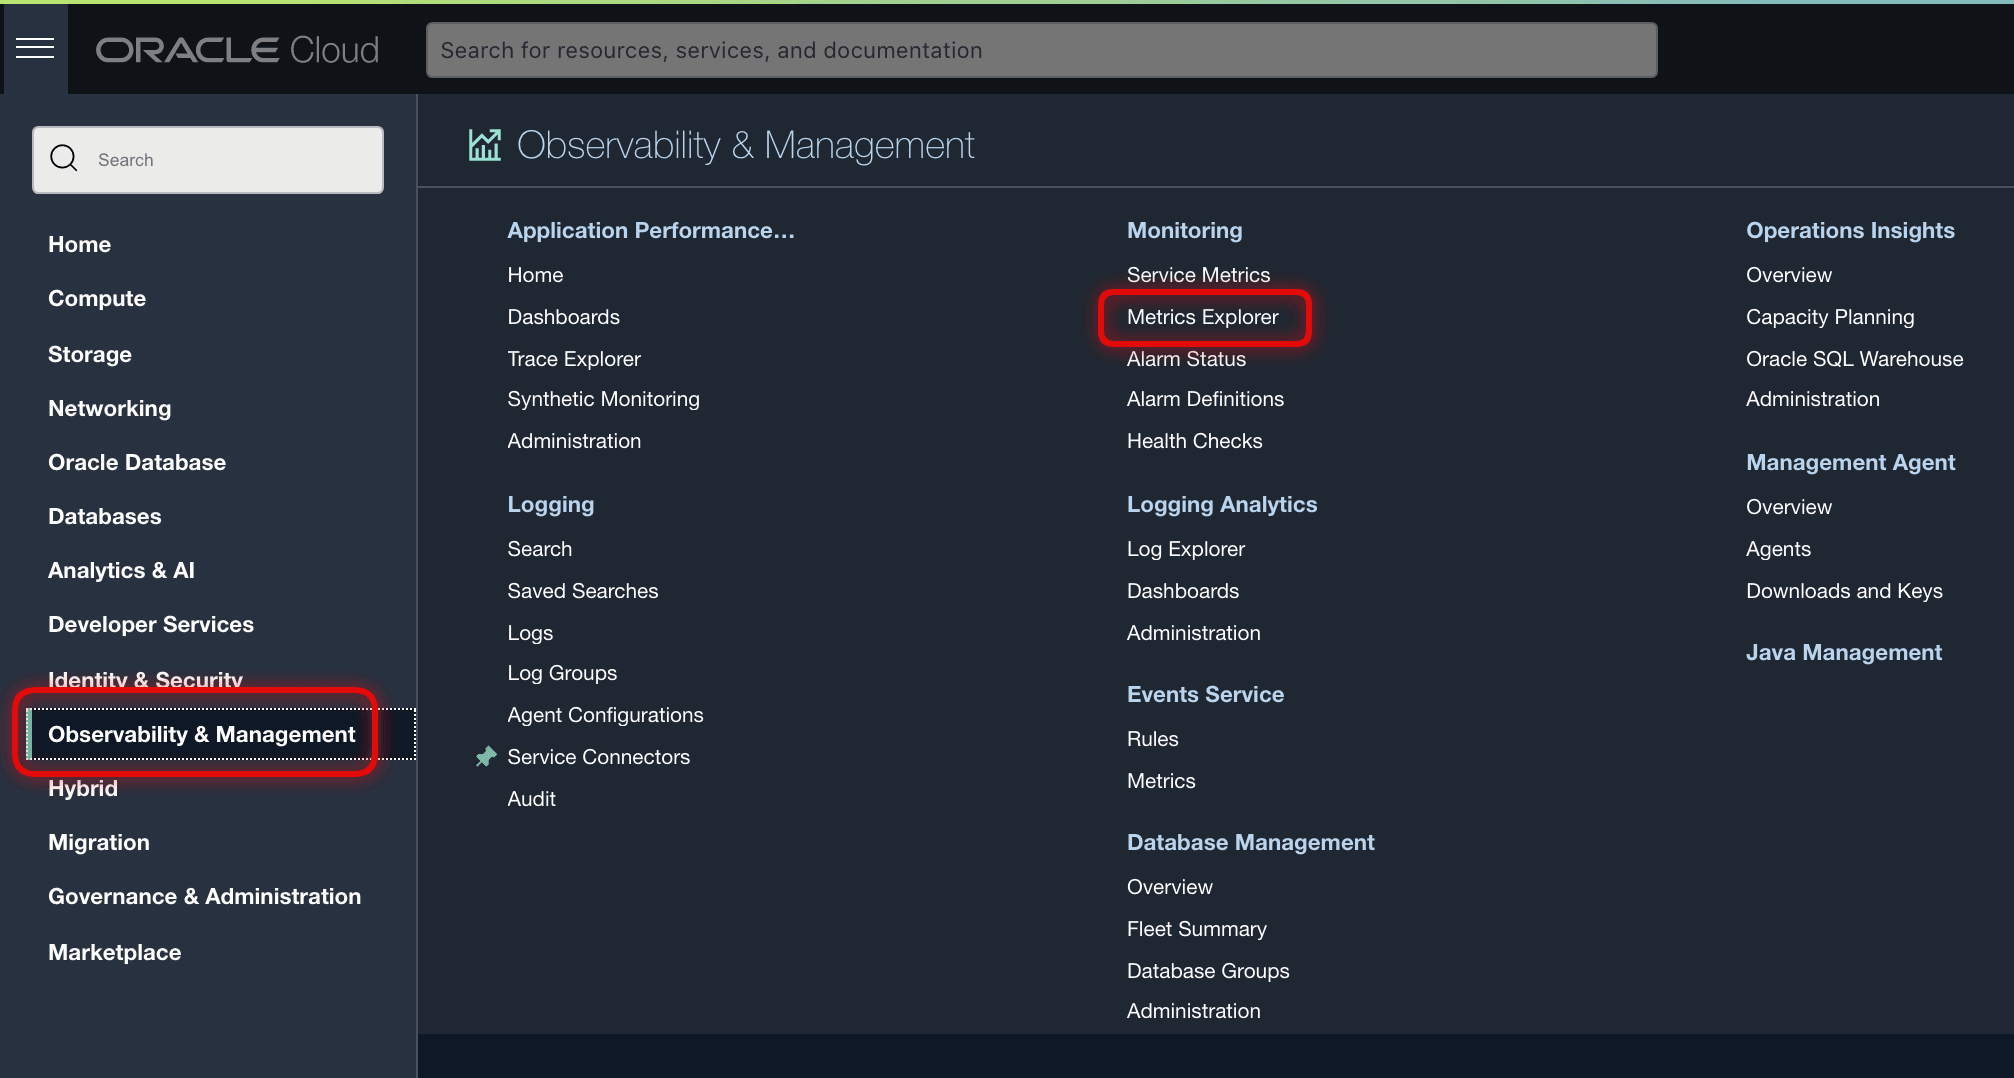
From the left navigation list click Observability & Management. Under Monitoring, click Service Metrics.
To use the metrics service to view Autonomous AI Database metrics:
To create an alarm on a specific metric, click Options and select Create an Alarm on this Query. See Managing Alarms for information on setting and using alarms.
Parent topic: Monitor Performance with Autonomous AI Database Metrics
Autonomous AI Database Metrics and Dimensions
You can limit the instances where you see metrics with dimensions. The available dimensions include: workload type, instance display name, region, and the instance OCID.
Use dimensions by selecting values in the Oracle Cloud Infrastructure Console Service Metrics page or by setting dimension values with the API. See View Metrics for Autonomous AI Databases in a Compartment to view metrics and to select metric dimensions.
Parent topic: Monitor Performance with Autonomous AI Database Metrics
Use Custom Metrics on Autonomous AI Database
Describes how to create and publish custom metrics on Autonomous AI Database.
Autonomous AI Database provides many database related metrics that are available through the OCI Monitoring service. In addition, you can create custom metrics to collect, publish, and analyze your own metrics. A custom metric collects specified data from your Autonomous AI Database instance and publishes the data to the OCI Monitoring service using a REST API provided by the OCI SDK.
Prerequisites
-
Obtain Oracle Cloud Infrastructure access through Oracle Cloud Free Tier or a paid Cloud Account.
See Get an Oracle Cloud Account for more information.
-
Create an Autonomous AI Database instance or have access to an existing Autonomous AI Database instance.
See Provision an Autonomous AI Database Instance for more information.
-
Obtain ADMIN credentials for your Autonomous AI Database instance.
-
Use Database Actions or any of the Oracle Database clients, such as SQL Developer or SQL*Plus to connect to the database.
See Connect to Autonomous AI Database for more information.
- You need access to the OCI Monitoring service and OCI Identity and Access Management.
See Publishing Custom Metrics Using the API for more information.
Overview of Custom Metrics with OCI Monitoring Service
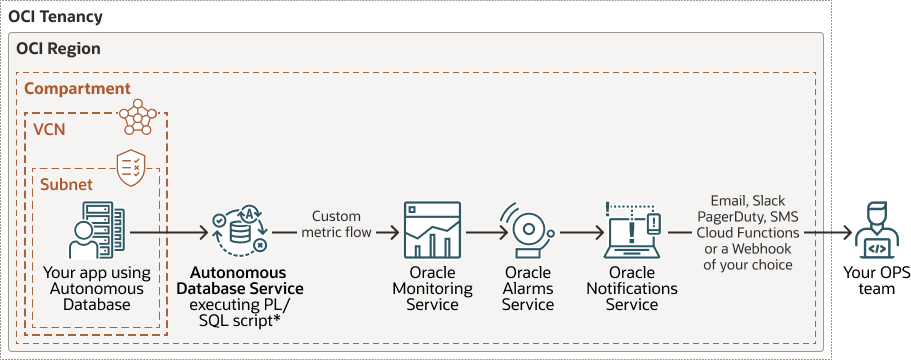
The following figure shows the steps to create and publish custom metrics on Autonomous AI Database. This shows that you collect metric data with a script running on your Autonomous AI Database instance and you publish this data to the OCI Monitoring service, and how you can create alarms and notifications for metric values.
-
Create and deploy a PL/SQL script on your Autonomous AI Database instance. This script runs periodically to compute, collect, and publish custom metrics to the OCI Monitoring service.
-
The Autonomous AI Database instance can be on a public or on a private endpoint. The communication between the Autonomous AI Database instance and the OCI Monitoring service takes place on the Oracle Cloud network. This means, to publish metrics on the OCI Monitoring service you do not need to create a service gateway.
Create and Publish Custom Metrics
To create and publish custom metrics:
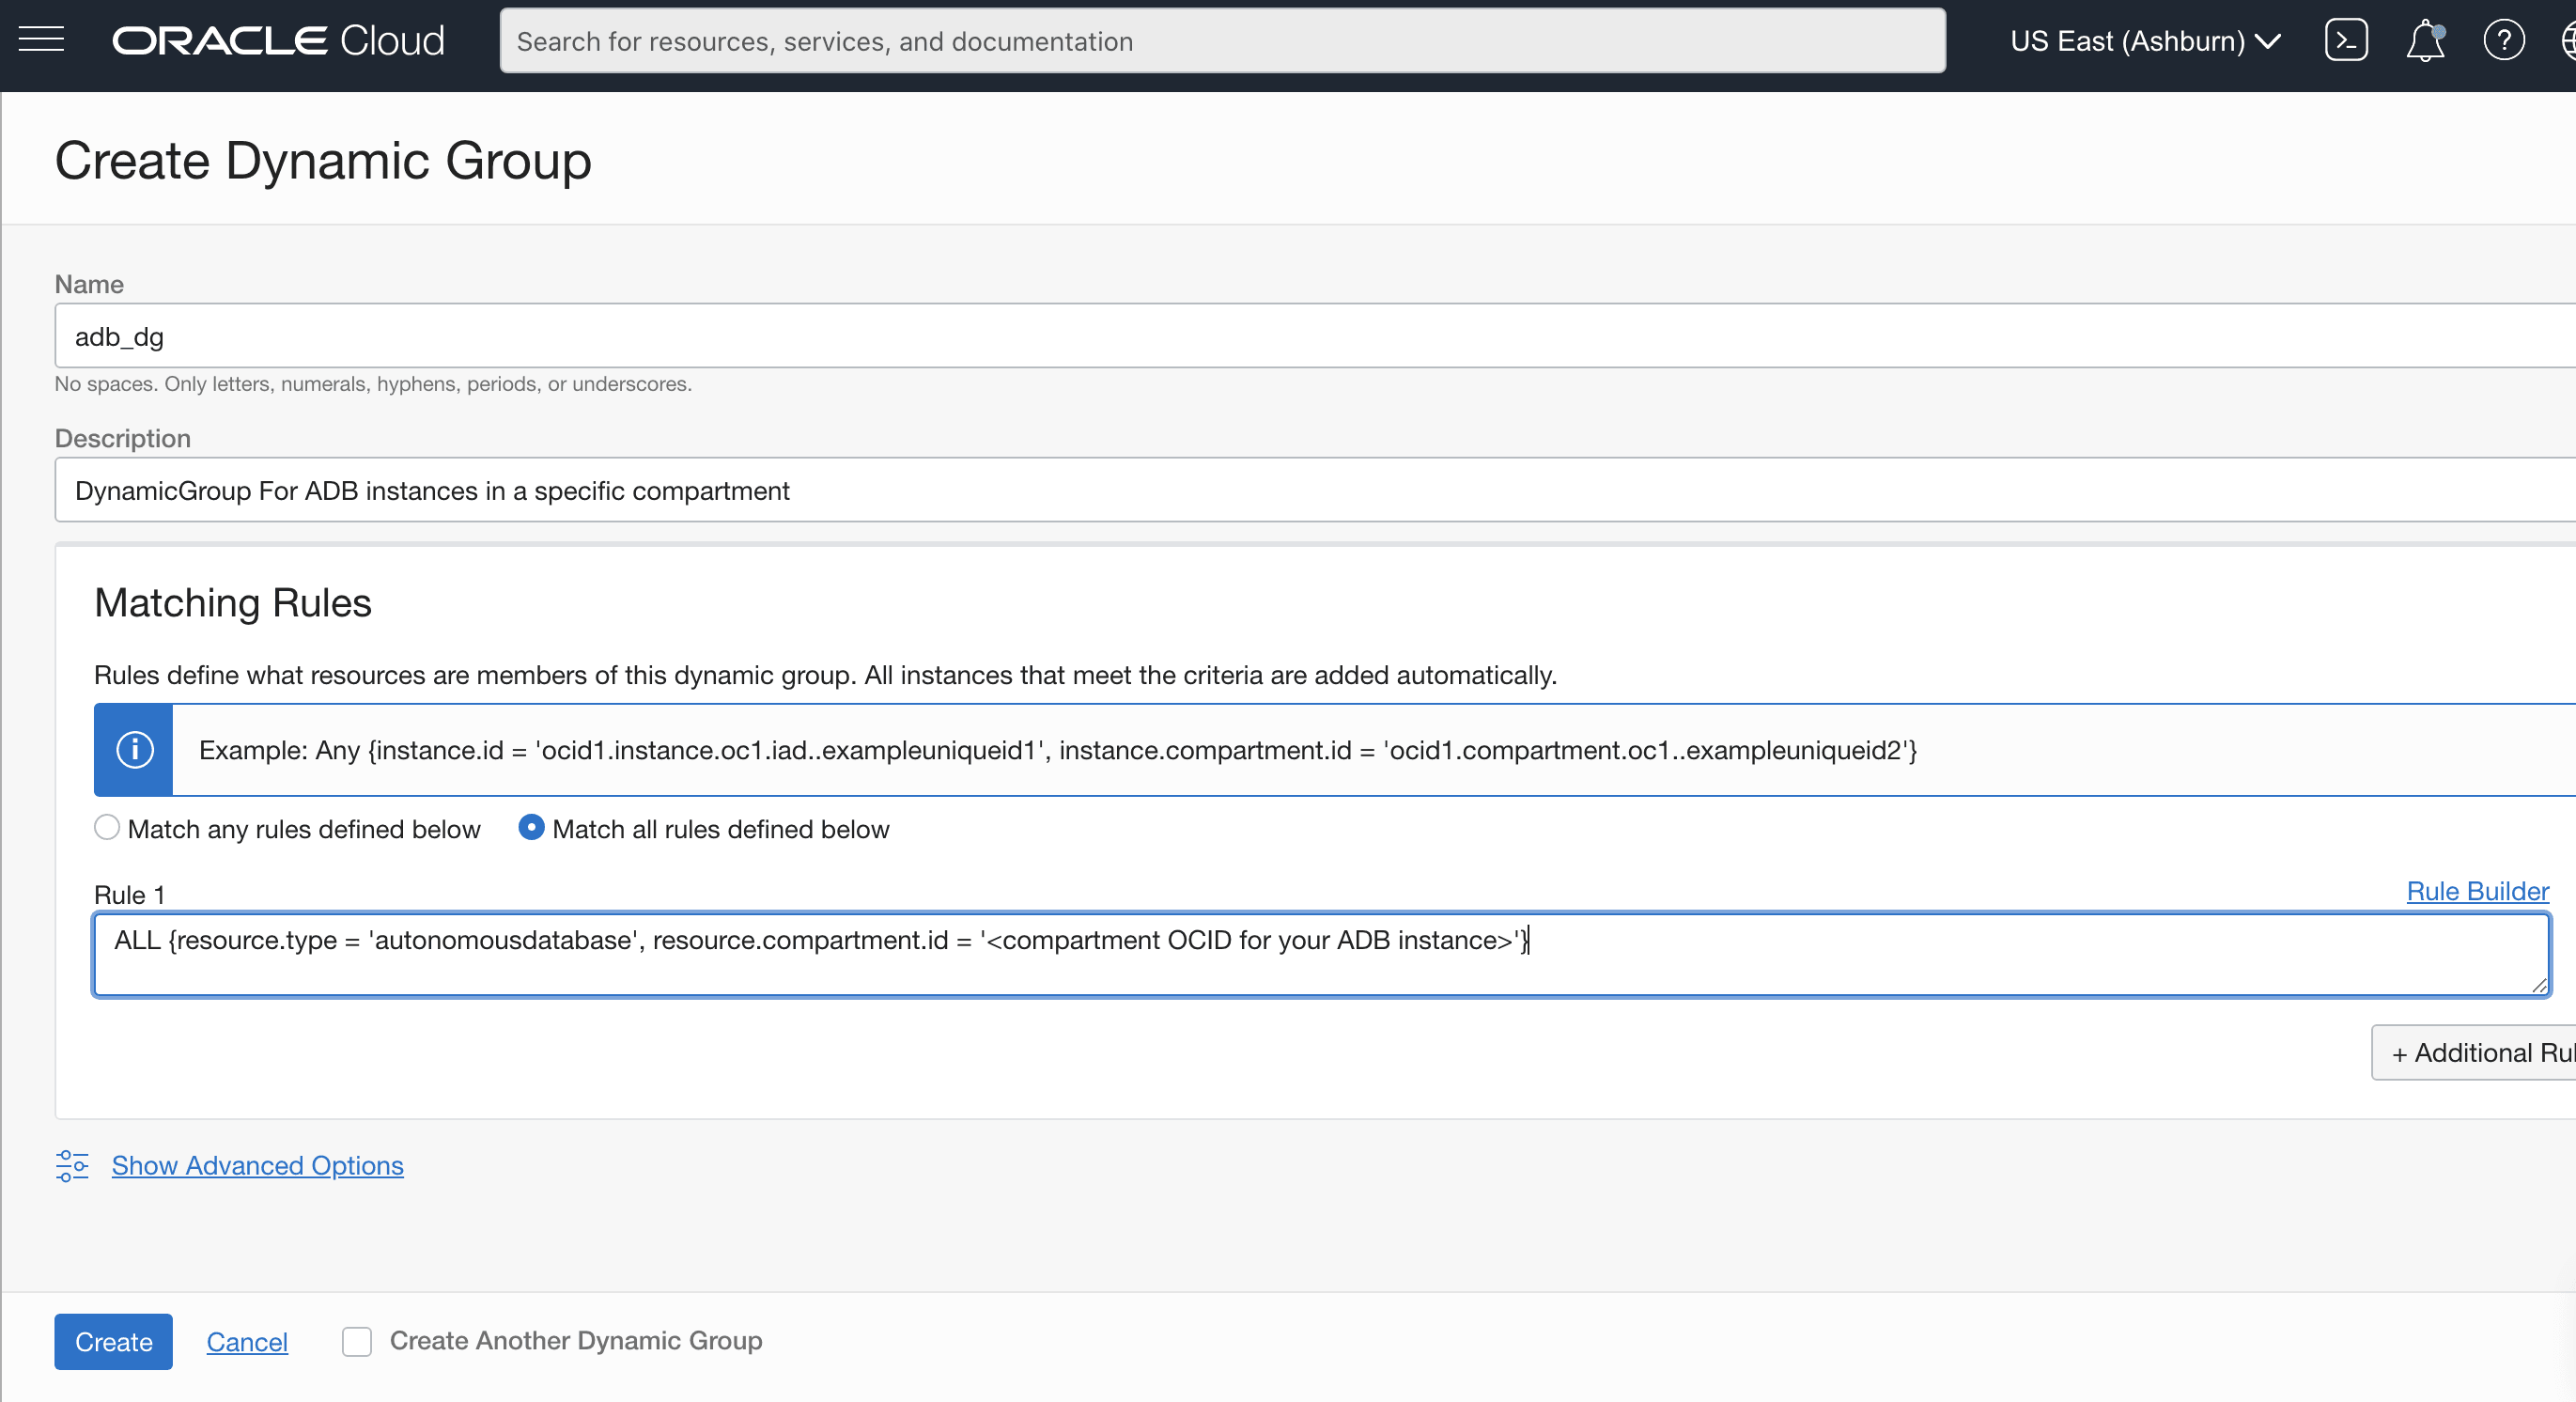
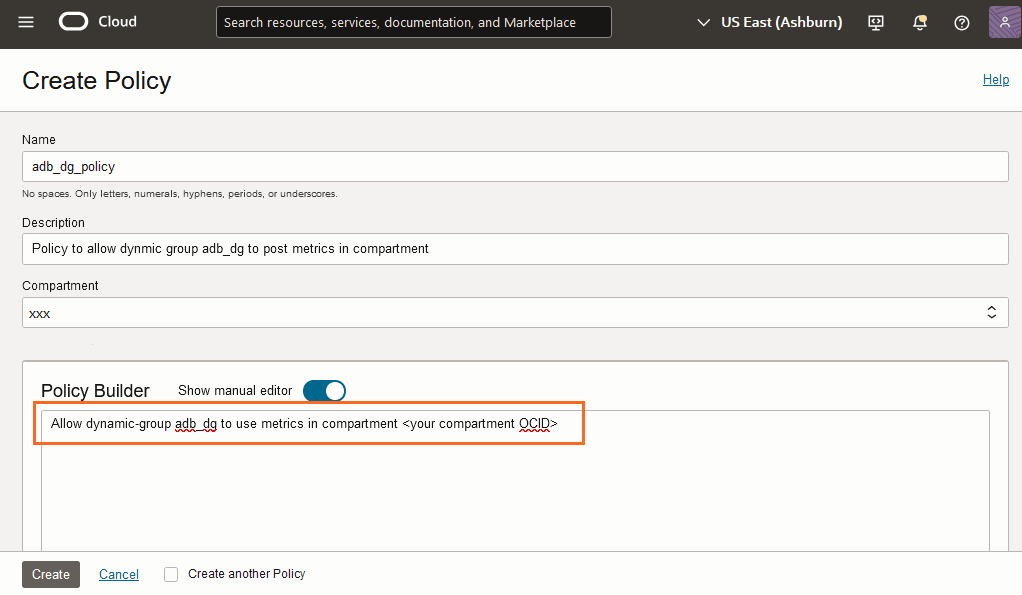
After you create custom metrics you can use the metrics just like any predefined metrics in OCI Monitoring service. This means you can analyze custom metrics with the Metrics Query Language (MQL) and set up alarms and notifications to notify you whenever an event of interest occurs.
See the following for more information:
Parent topic: Monitor Performance with Autonomous AI Database Metrics


