31 The Data Analysis Tool
The Data Analysis tool enables you to create Analytic Views with multidimensional metadata. You create Analytic Views on top of a fact table with several dimensions and hierarchies. Analytic views refer to tables in the database and allow users to create hierarchies for dimensions.
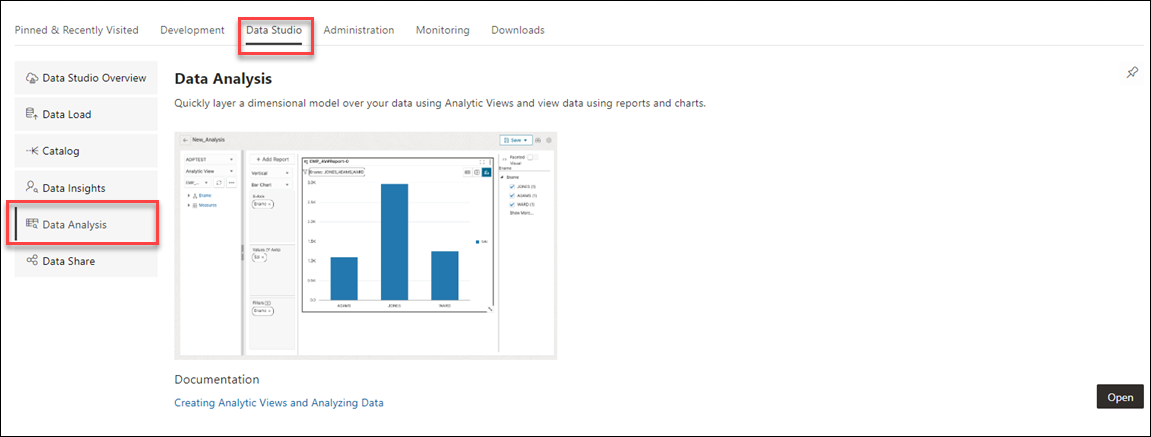
Select the Data Analysis card in the Database Actions home page to access this tool. You can also access it by clicking the Selector icon and selecting Data Analysis from the Data Tools menu in the navigation pane.
Note:
If you do not see the Data Analysis card then your database user is missing the required DWROLE role.
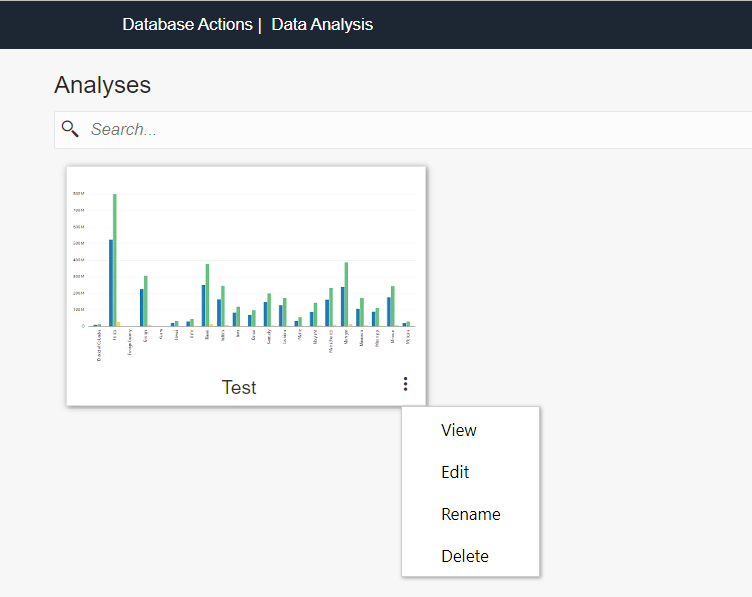
The Data Analysis page is used to obtain information about the Analytic Views available on your Oracle Autonomous Database.
You can select both hierarchies and measures from Analytic Views. Hierarchies are DB objects that allow users to define relationships between various levels or generations of dimension members. As the name implies, hierarchies organize data using hierarchical relationships. With this tool you can analyze and visualize data in different Points of View (POV). You can export the metadata and visualize it with sophisticated tools like Oracle Analytics Cloud (OAC) and Tableau.
Advantages of Data Analysis tool
- Visualize, analyze and inspect your data clearly and efficiently with pivot tables
- Calculate total number of errors present in the Analytic View you create and provide solutions to minimize the errors
- Automatically display meaningful insights to help you make better decisions
- Analyze your data across dimensions with support for hierarchical aggregation and drill-down
- Share your Analytic Views with the tool of your choice over various options of raw data consumption to draw meaningful insights and make them accessible to any user
By identifying relationships among tables and columns, Analytic Views enable your system to optimize queries. They also open new avenues for analyzing data. These avenues include data insights, improved hierarchy navigation, and the addition of hierarchy-aware calculations.
This tool runs complex and hierarchical SQL queries along with SQL extensions in the background, which simplifies real-time calculations. It makes complex data more accessible and easier to understand.
The Data Analysis Page
Note:
- OAC has in-built tools to search and utilize Analytic Views.
- We have no direct support for Microsoft Power BI, yet its users can map their tool to the AV transparency views to avail some of the benefits of Analytic Views.
Searching and obtaining information about Analytic Views
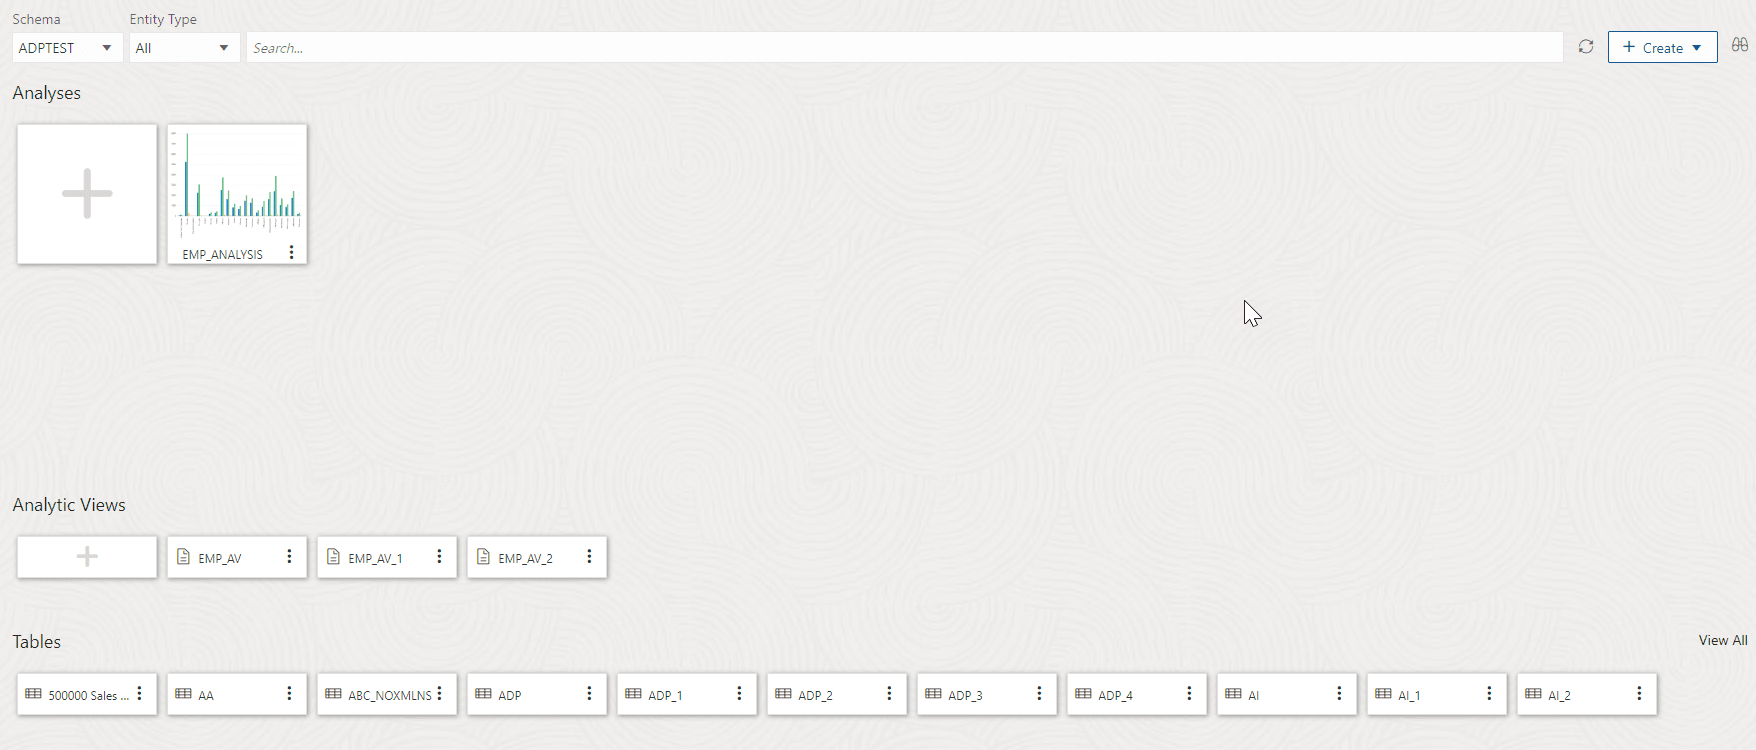
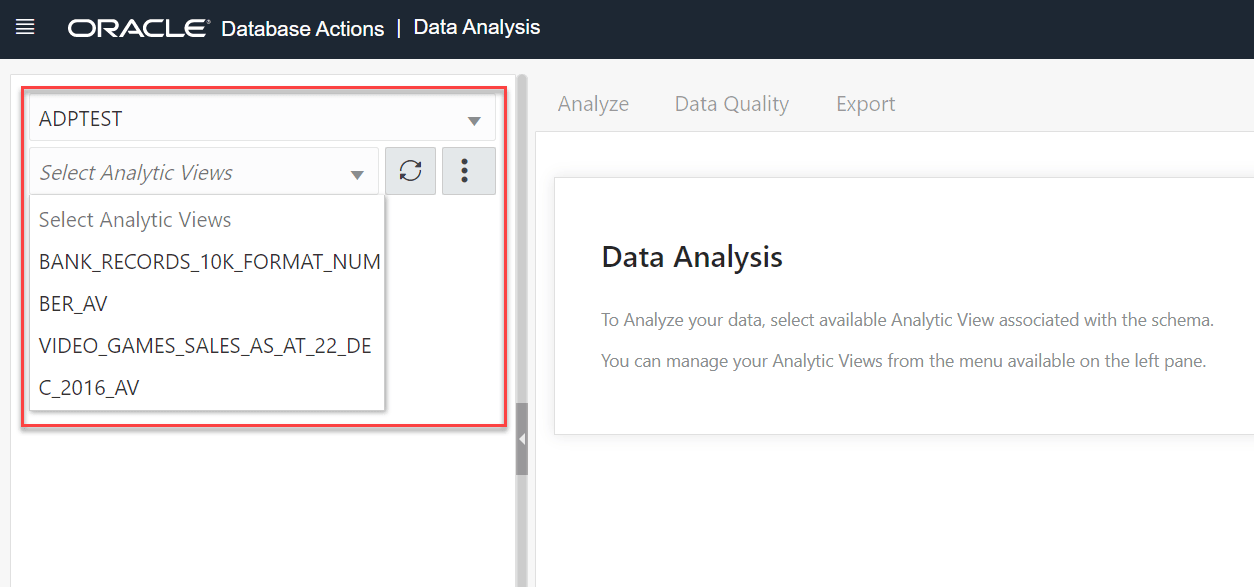
When you first open the Data Analysis page, it displays the list of schemas and Analytic Views. With Select Schema, you can select a preferred Schema from a list of schemas available in the drop-down.
The Select Analytic Views drop-down enables you to select an available Analytic View associated with the schema. When you create an Analytic View, it appears in the drop-down option with your schema. The Refresh AV icon refreshes the contents of the selected Analytic View.
The Action icon next to the Refresh AV button enables you to manage Analytic Views. You can Create Analytic View, Edit Analytic View, Compile Analytic View, Show the Data Definition Language (DDL) that generates the Analytic View or Delete Analytic View from the menu.
Obtain information about Analytic Views
By default, Analytic Views are filtered by the current user's schema, as indicated by the schema list below the menu-bar. You can remove the selected schema filter by selecting another user's schema. To search for Analytic Views in other schemas, select one of the schemas from the drop-down.
If there is no Analytic View associated with the schema selected, the tool prompts you to create an Analytic View.
Creating Analytic Views
You can create Analytic Views and view information about them. You can also edit and perform other actions on them.
When you create an Analytic View, you identify a fact table that contains the data to inspect. The Generate Hierarchies and Measures button looks at the contents of that table, identifies any hierarchies in the fact table, and searches for other tables that may contain related hierarchies.
- Autonomous Aggregate Cache, which uses the dimensional metadata of the Analytic View to manage a cache and that improves query response time.
- Analytic View Transparency Views, which presents Analytic Views as regular database views and enables you to use your analytic tools of choice while gaining the benefits of Analytic Views.
- Analytic View Base Table Query Transformation, which enables you to use your existing reports and tools without requiring changes to them.
Create Analytic View
To create Analytic View, click Create Analytic View to begin the process.
Click Cancel to cancel the creation of the Analytic View at any time.
Specify Attributes of the Analytic View
- The name for the Analytic View
- The fact table for the view
- Advanced options
You can also preview the data of the fact table and see statistics about that data.
In the Name field, specify a name of your choice.
The Schema field has the current user's schema. You can only create an Analytic View in that schema.
In the Fact Table field, expand the drop-down list and click More Sources. The Select Sources dialog box has a list of the available tables and views. Select a table or view from the list.
To filter the list, begin typing characters in the Filter field. As you type, the list changes to show the tables or views that contain the characters. Clear the field to show the complete list again. After you select a table or view, click OK.
To enable or disable the advanced options, on the Create Analytic View pane, click the Show Advanced Options icon at the bottom left. Select or deselect options as desired.
To view the data in the fact table and statistics about the data, click the Preview Data button. In the Preview and Statistics pane, the Preview tab shows the columns of the table and the data in the columns.
The Statistics tab shows the size of the table and the number of rows and columns. The statistics may take a few moments to appear, during which time the message, "No statistics available..." may appear. The statistics include the names of the columns, their data types, the number of distinct values and null values, the maximum and minimum values, and other information. The bar graph displays the top unique column values and the number of their occurrences for the selected column. Point to a bar in the graph to see the number of occurrences of the unique value.
Click Close to close the Preview and Statistics pane and return to the Create Analytic View pane.
Click on Generate Hierarchies and Measures icon.
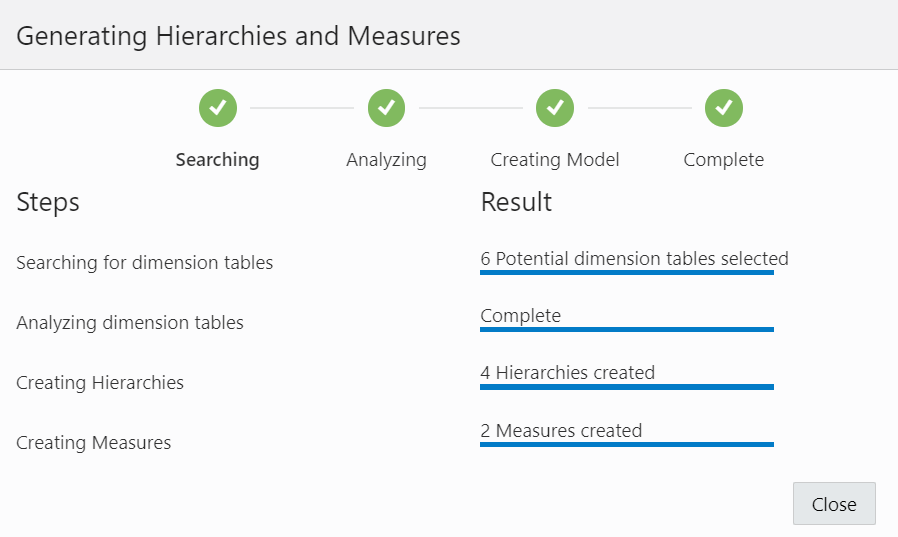
The Generating Hierarchies and Measures dialog box displays the progress of searching for dimension tables, analyzing the dimension tables and identifying and creating the data sources, joins, hierarchies, and measures to use. When the process completes, click Close.
The Search for Dimension Tables check box when selected, enables you to search for dimension tables while generating hierarchies and measures.
After the hierarchies and measures are generated, they are displayed under their respective tabs. Review the hierarchies and measures created for you.
Specify the Name, Fact Table and select Advanced Options in the General tab of Create Analytic View pane. Click Create to generate an Analytic View.
View Data Sources
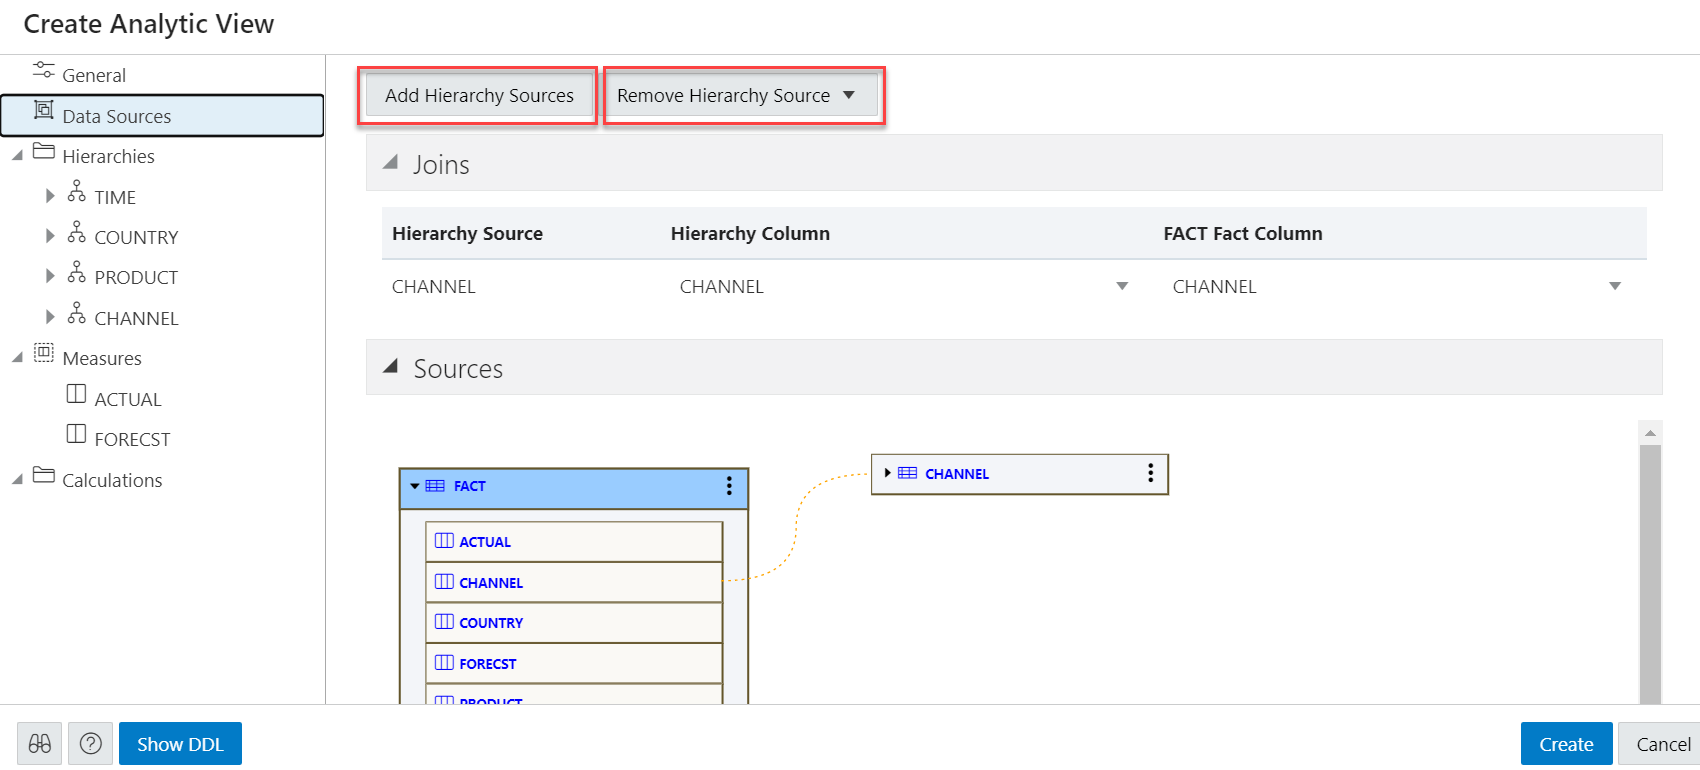
The Data Sources tab displays the sources of the data and the relationships among them. It has a graphical display of the fact table and the related dimension tables. For example, a fact table of health insurance data might have columns for geography identifiers, income codes, and gender codes. The Data Sources tab would display items for the fact table and for the geography, income, and gender dimension tables.
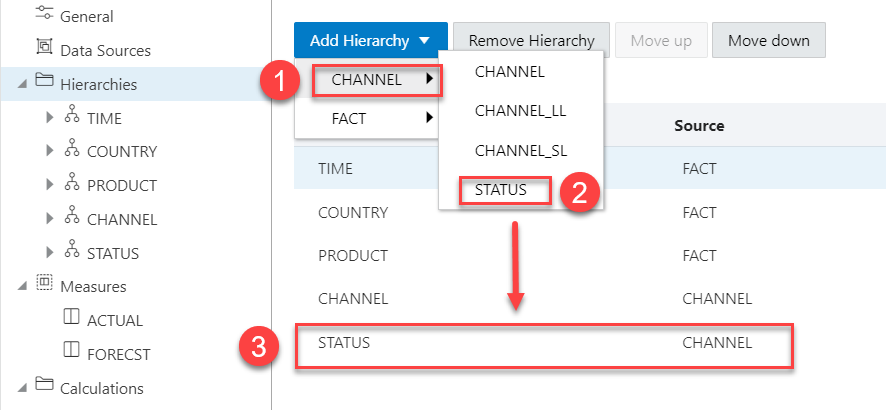
You can add hierarchies from data sources even after generating hierarchies from the existing fact table. You can add one or more hierarchies to your new or existing analytic view. Multiple hierarchies can be defined and used in an analytical view, however only one will be used by default.
Right-click the Data Sources tab and select Add Hierarchy Sources or select Add Hierarchy Sources.
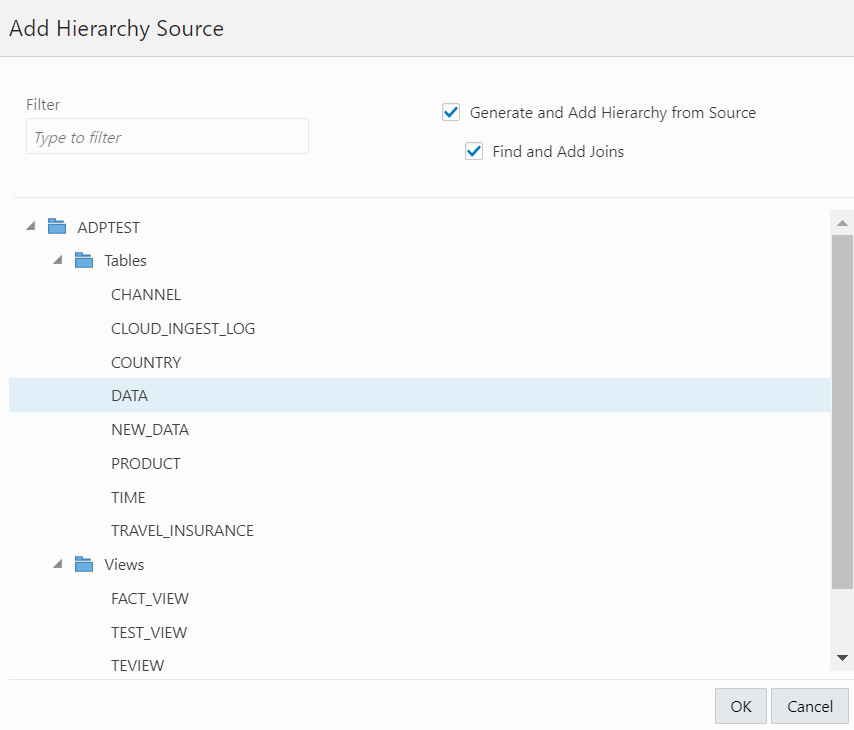
Selecting Add Hierarchy Sources launches an Add Hierarchy Source dialog box.
You can view all the fact tables and views associated with the analytic view.
In the filter field, you can either manually look for the source or start typing to search for the fact table or views from the list of available fact tables and views. After typing the full name of the source, the tool automatically matches the fact table or view.
Select Generate and Add hierarchy from Source to generate analysis and hierarchies associated with the source data you select.
Select Find and Add Joins to link all the data sources with the fact table.
Click OK to select the source.
The Generating Hierarchies and Measures dialog box displays the progress of analyzing the dimension tables and creating the hierarchies. When the process completes, click Close.
Note:
When you add a hierarchy from the data source, you see the new hierarchy in the list of hierarchies in the Hierarchies tab. You can navigate between the Data Sources tab, the Hierarchies tab, the Measures tab, the Calculations tab. You can add a hierarchy from a source that is not connected by navigating back to the Data Sources tab.
Select Remove Hierarchy Source to remove the hierarchies you create from the data sources. You cannot remove hierarchies generated from the fact table you select from this option.
Expand Joins to view the Hierarchy Source, Hierarchy Column and the Fact column mapped with the Analytic View. The Joins is visible only when the hierarchy table differs from the fact table.
Expand Sources to view the fact table associated with the Analytic View. The data model expands to include the data from the source that you added.
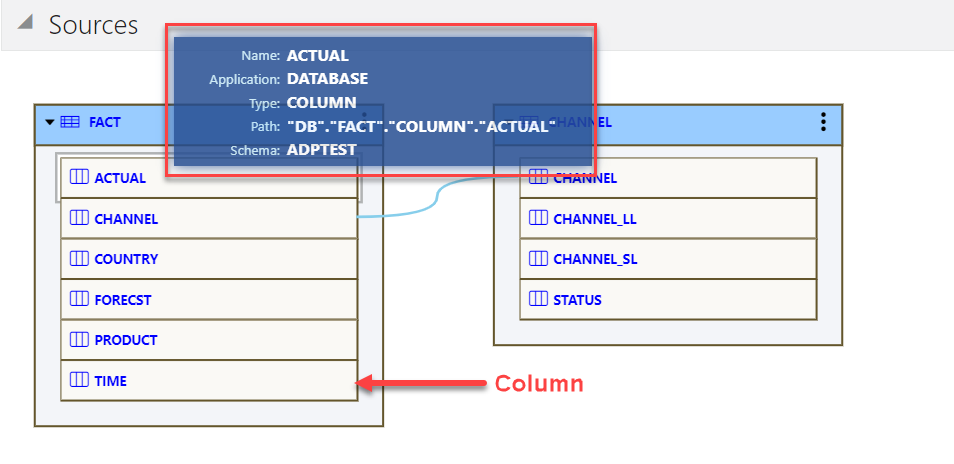
Pointing to an item displays the name, application, type, path and the schema of the table. Click the Actions (three vertical dots) icon at the right of the item to display a menu to expand or collapse the view of the table.
An expanded item displays the columns of the table. Pointing to a column displays the name, application, type, path, and schema of the column.
The lines that connect the dimension tables to the fact table indicate the join paths between them. Pointing to a line displays information about the join paths of the links between the tables. If the line connects a table that is collapsed, then the line is dotted. If the line connects two expanded tables, then the line is solid and connects the column in the dimension table to the column in the fact table.
View and Manage Hierarchies
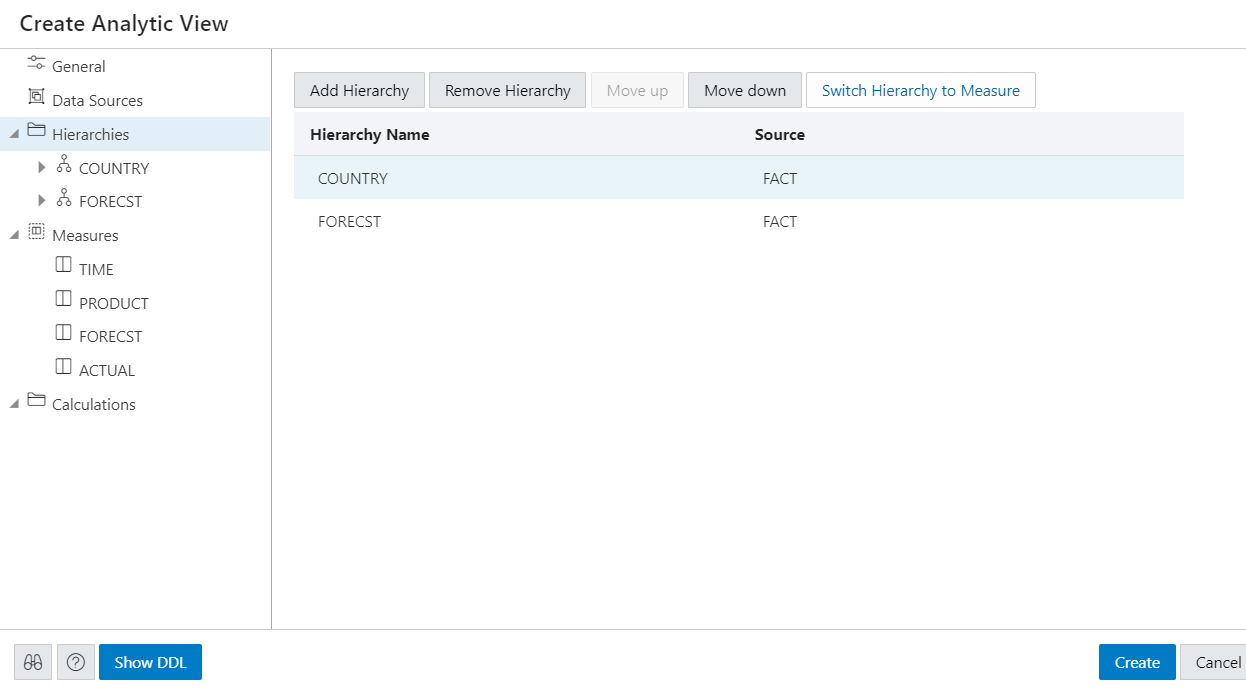
The Hierarchies tab displays the hierarchies generated by the Analytic View creation tool. The display includes the name of the hierarchy and the source table.
An analytic view must include at least one hierarchy.
To add a Hierarchy, click Add Hierarchy. This results in a display as a list of column in that table. Select a column that operates as the detailed level of the hierarchy and be the join-key to the fact table.
To remove the hierarchy, select the hierarchy you want to remove from the list and click Remove Hierarchy
Select Move Up or Move Down to position the order of the Hierarchy in the resulting view.
Click Switch Hierarchy to Measure to change the hierarchy you select to a measure in the Measures list.
You can also Add Hierarchy and Add Hierarchy From Table by right-clicking the Hierarchy tab.
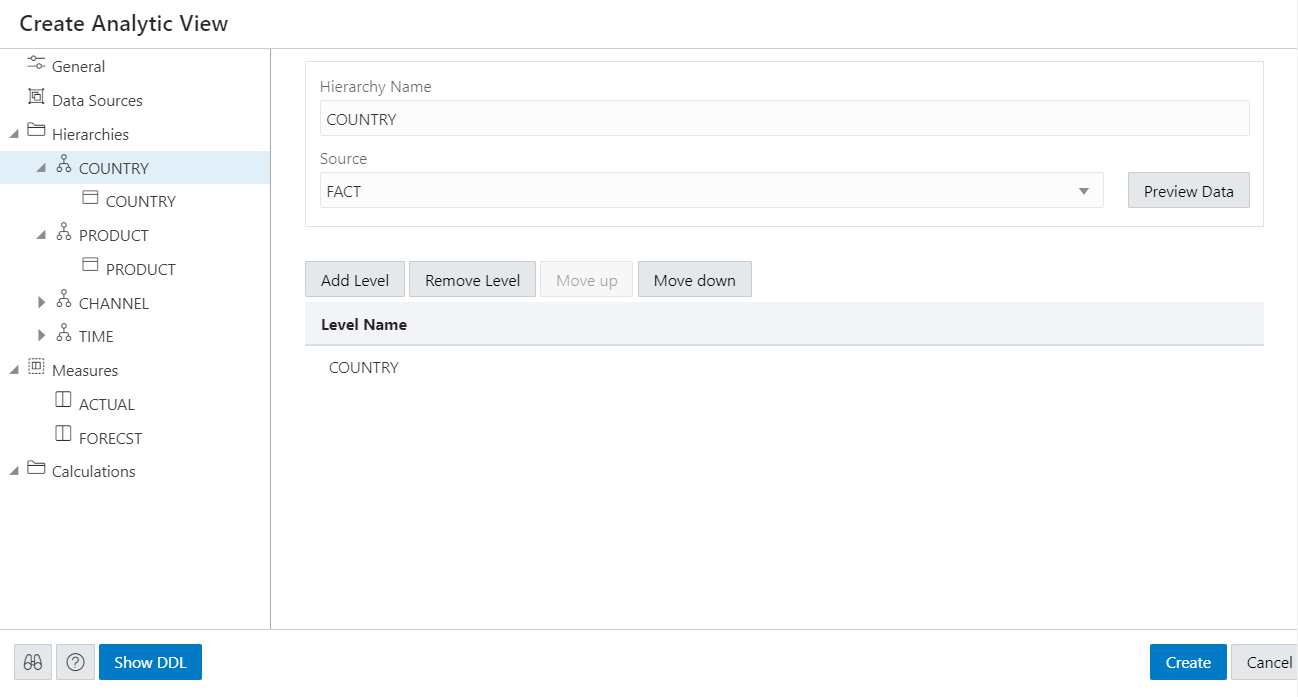
If you click on a hierarchy name, a dialog box displays the Hierarchy Name and Source.
To change the source, select a different source from the drop-down list.
Select Add Level to add a level to the hierarchy. Click Remove Level to remove the selected level from the hierarchy.
To view the data in the fact table and statistics about the data, click the Preview Data button. In the Preview and Statistics pane, the Preview tab shows the columns of the table and the data in the columns. The Statistics tab shows the size of the table and the number of rows and columns.
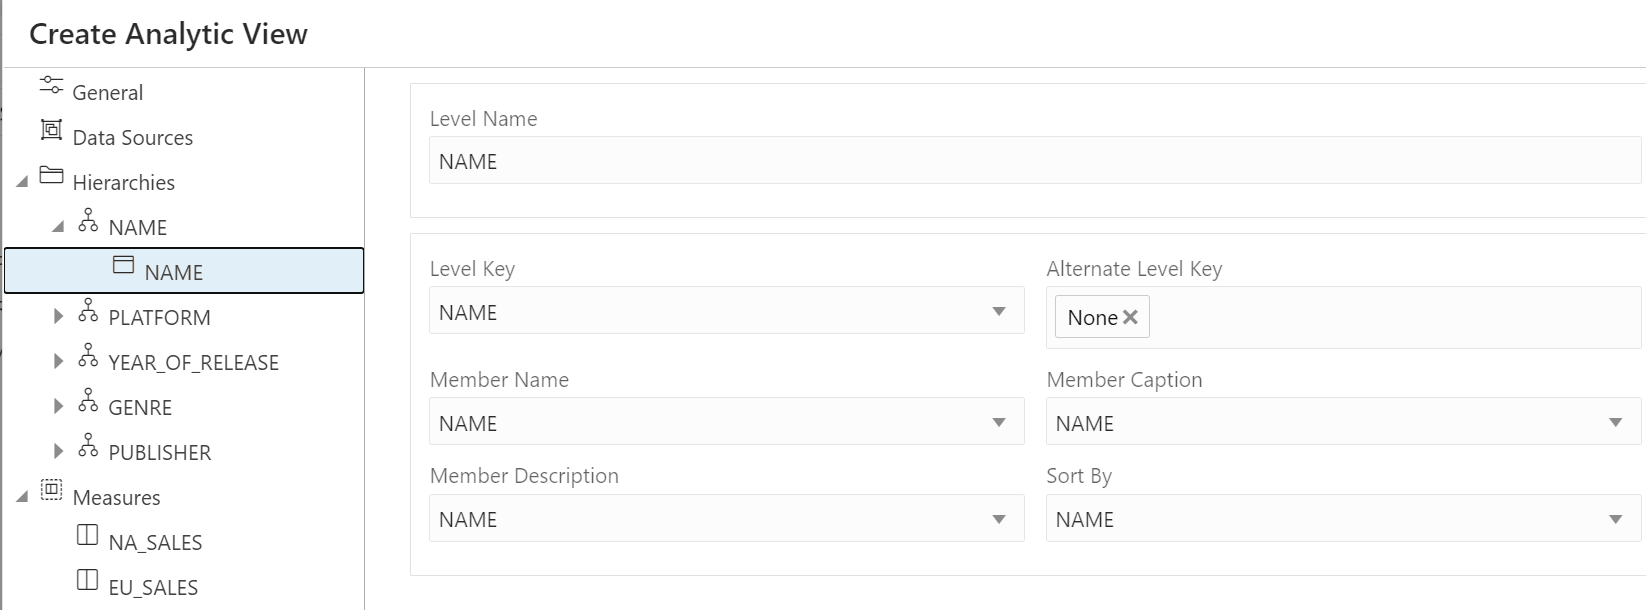
If you click on a particular level in the Hierarchy tab, a dialog box displays it's respective Level Name, Level Key, Alternate Level Key, Member Name, Member Caption, Member Description, source, and Sort By drop-down. To change any of the field values, enter the value in the appropriate field.
Member Captions and Member Descriptions generally represent detailed labels for objects. These are typically end-user-friendly names. For example, you can caption a hierarchy representing geography areas named GEOGRAPHY_HIERARCHY as "Geography" and specify its description as "Geographic areas such as cities, states, and countries."
To see the measures for the Analytic View, click Measures tab. To immediately create the Analytic View, click Create. To cancel the creation, click Cancel.
View and Manage Measures
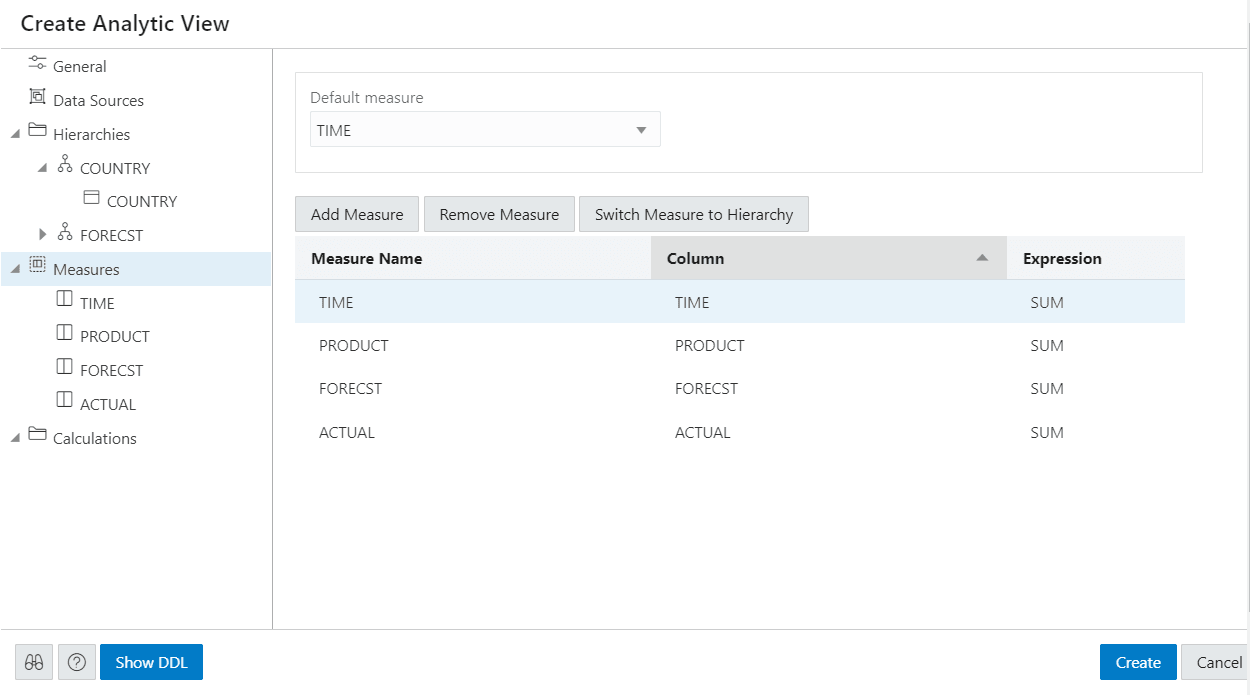
The Measures tab displays the measures suggested for the Analytic View. It displays the Measure Name, Column, and operator Expression for each measure.
The measures specify fact data and the calculations or other operations to perform on the data.
To add measures, click Add Measure. You can view a new measure at the bottom of the measures list. To remove the measure, select the measure you want to remove from the list and click Remove Measure.
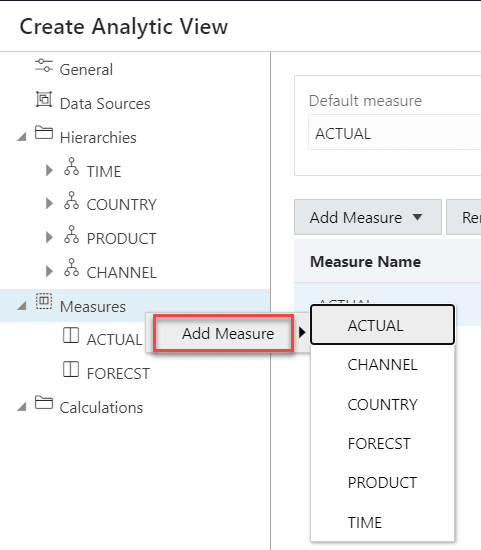
To alternatively add a measure from the data source, right- click the Measures tab. This pops up a list of columns that can be used as measures. Select one measure from the list.
You can exclude a column from the measures on right-clicking the Measures tab and selecting Remove Measure.
Click Switch Measure to Hierarchy to change the measure you select to hierarchy in the Hierarchies list.
You must specify a measure as the default measure for the analytic view; otherwise, the first measure in the definition is the default. Select Default Measure from the drop-down.
To add a measure, right-click the Measures tab and select Add Measure. To remove a measure, select the particular measure you want to remove, right-click on it and select Remove Measure.
You can select a different column for a measure from the Column drop-down list. You can select a different operator from the Expression drop-down list.
In creating an analytic view, you must specify one or more hierarchies and a fact table that has at least one measure column and a column to join to each of the dimension tables outside of the fact table.
Create new calculated measures
You can add measure calculations to a query of an analytic view.
The measures and hierarchies associated with the analytic views enable us to create new calculated measures.
Calculated measures return values from data stored in one or more measures. You compute these measures at run time.
Note:
You can create the measures without increasing the size of the database since the calculated measures do not store the data. However, they may slow performance. You need to decide which measures to calculate on demand.
The Analytic Views provides easy-to-use templates for creating calculated measures.
Once you create a calculated measure, it appears in the list of measures of the Analytic View .You can create a calculated measure at any time which is available for querying in SQL.
The Data Analysis tool provides easy-to-use templates for creating calculated measures.
Click Add Calculated Measure to add calculations to the measures. You can view the new calculation with system generated name in the Calculations tab.
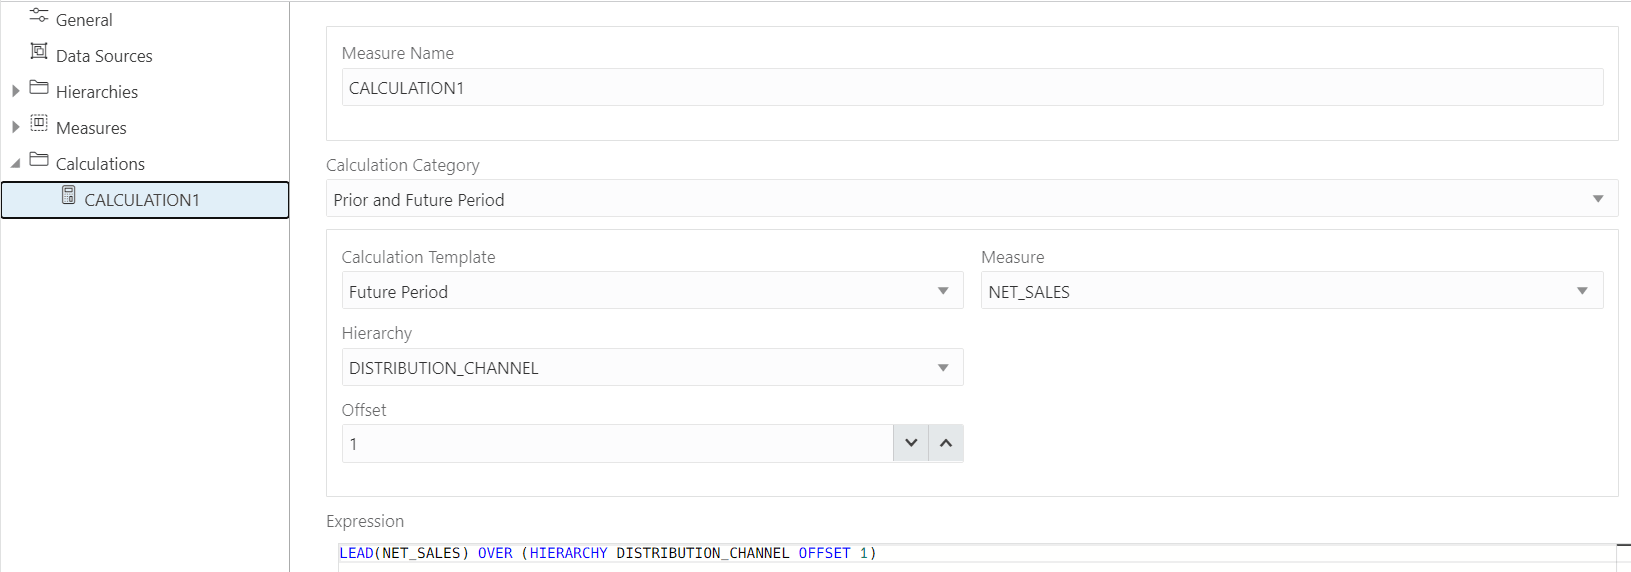
Click the newly created calculated measure.
In the Measure Name field, enter the name of the calculated measure.
You can select preferred category of calculation from a list of options such as Prior and Future Period, Cumulative Aggregates, Period To Date, Parallel Period, Moving Aggregates, Share, Qualified Data Reference, and Ranking using the Calculation Category drop-down.
Your choice of category of calculation dynamically changes the Calculation Template.
For more details on how to use Calculation templates, see Using Calculation Templates.
Select the Measure and Hierarchy on which you want to base the calculated measures.
Select Offset value by clicking the up or the down arrow. The number specifies the number of members to move either forward or backward from the current member. The ordering of members within a level is dependent on the definition of the attribute dimension used by the hierarchy. The default value is 0 which represents POSITION FROM BEGINNING.
The Expression field lists the expressions which the calculated measure uses.
On the creation of the Analytic view, the calculated measure appears in the navigation tree in the Calculated Measures folder.
Click Create. A confirmation dialog box appears that asks for your confirmation. Select Yes to proceed with the creation of Analytic View.
After creating the Analytic View, you will view a success message informing you of its creation.
On editing the Analytic View you create, you can view the calculated measure in the navigation tree in the Calculations folder.
Click the Tour icon for a guided tour of the worksheet highlighting salient features and providing information if you are new to the interface.
Click the help icon to open the contextual or online help for the page you are viewing.
Click Show DDL to generate Data Definition Language statements for the analytic view.
Edit Analytic View
You might want to edit an Analytic View to make changes to the data sources, the hierarchies, or the measures.
To edit an Analytic View, click the Action icon on the Analytic View item, then click Edit Analytic View. On the Edit Analytic View screen, select a tab and make changes as desired.
When you have completed the changes, click Update.
Using Calculation Templates
The Data Analysis tool provides templates for all of the calculations typically in demand for business intelligence applications.
The following topics describe the types of calculations available as calculation templates in the tool.
Cumulative Aggregates
Cumulative calculations start with the first time period and calculate up to the current member, or start with the last time period and calculate back to the current member.
The tool provides several aggregation methods for cumulative calculations:
-
Cumulative Average: Calculates a running average across time periods.
-
Cumulative Maximum: Calculates the maximum value across time periods.
-
Cumulative Minimum: Calculates the minimum value across time periods.
-
Cumulative Total: Calculates a running total across time periods.
You can choose the measure, the time dimension, and the hierarchy. For selecting the time range see "Choosing a Range of Time Periods" in Oracle OLAP User’s Guide.
Cumulative Calculation Example
This template defines a calculated measure using Cumulative Minimum.
Cumulative minimum of SALES in the TIME dimension and TIME.CALENDAR hierarchy within ancestor at level TIME.CALENDAR_YEAR. Total from beginning to current member.
These are the results of a query against the calculated measure, which displays values for the descendants of calendar year 2021. The minimum value for quarters begins with Q1-21 and ends with Q4-21, and for months begins with Jan-21 and ends with Dec-21.
TIME TIME_LEVEL SALES MIN_SALES -------- -------------------- ---------- ---------- Q1.21 CALENDAR_QUARTER 32977874 32977874 Q2.21 CALENDAR_QUARTER 35797921 32977874 Q3.21 CALENDAR_QUARTER 33526203 32977874 Q4.21 CALENDAR_QUARTER 41988687 32977874 JAN-21 MONTH 11477898 11477898 FEB-21 MONTH 10982016 10982016 MAR-21 MONTH 10517960 10517960 APR-21 MONTH 11032057 10517960 MAY-21 MONTH 11432616 10517960 JUN-21 MONTH 13333248 10517960 JUL-21 MONTH 12070352 10517960 AUG-21 MONTH 11108893 10517960 SEP-21 MONTH 10346958 10346958 OCT-21 MONTH 14358605 10346958 NOV-21 MONTH 12757560 10346958 DEC-21 MONTH 14872522 10346958
Prior and Future Period
The Data Analysis tool provides several calculations for prior or future time periods.
Here are the calculations used for for prior or future time periods:
-
Prior Period: Returns the value of a measure at an earlier time period.
-
Difference From Prior Period: Calculates the difference between values for the current time period and an earlier period.
-
Percent Difference From Prior Period: Calculates the percent difference between the values for the current time period and an earlier period.
-
Future Period: Returns the value of a measure at a later time period.
-
Difference From Future Period: Calculates the difference between the values for the current time period and a later period.
-
Percent Difference From Future Period: Calculates the percent difference between the values for the current time period and a later period.
When creating a calculation for prior or future time periods, you choose the measure, the time dimension, the hierarchy, and the number of periods from the current period.
Prior Period Example
This template defines a calculated measure using Prior Period:
Prior period for measure SALES in TIME dimension and TIME.CALENDAR hierarchy 1 period ago.
These are the results of a query against the calculated measure. The PRIOR_PERIOD
column shows the value of Sales for the preceding period at the same level in the Calendar hierarchy.
TIME TIME_LEVEL SALES PRIOR_PERIOD -------- -------------------- ---------- ------------ 2020 CALENDAR_YEAR 136986572 144290686 2021 CALENDAR_YEAR 140138317 136986572 Q1.20 CALENDAR_QUARTER 31381338 41988687 Q2.20 CALENDAR_QUARTER 37642741 31381338 Q3.20 CALENDAR_QUARTER 32617249 37642741 Q4.20 CALENDAR_QUARTER 35345244 32617249 Q1.21 CALENDAR_QUARTER 36154815 35345244 Q2.21 CALENDAR_QUARTER 36815657 36154815 Q3.21 CALENDAR_QUARTER 32318935 36815657 Q4.21 CALENDAR_QUARTER 34848911 32318935
Period to Date
Period-to-date functions perform a calculation over time periods with the same parent up to the current period.
These functions calculate period-to-date:
-
Period to Date: Calculates the values up to the current time period.
-
Period to Date Period Ago: Calculates the data values up to a prior time period.
-
Difference From Period to Date Period Ago: Calculates the difference in data values up to the current time period compared to the same calculation up to a prior period.
-
Percent Difference From Period To Date Period Ago: Calculates the percent difference in data values up to the current time period compared to the same calculation up to a prior period.
When creating a period-to-date calculation, you can choose from these aggregation methods:
-
Sum
-
Average
-
Maximum
-
Minimum
You also choose the measure, the time dimension, and the hierarchy.
Period to Date Example
This template defines a calculated measure using Period to Date.
Gregorian Year to date for SALES in the TIME dimension and TIME.CALENDAR hierarchy. Aggregate using MINIMUM from the beginning of the period.
These are the results of a query against the calculated measure. The MIN_TO_DATE
column displays the current minimum SALES
value within the current level and year.
TIME TIME_LEVEL SALES MIN_TO_DATE -------- -------------------- ---------- ----------- Q1.21 CALENDAR_QUARTER 36154815 36154815 Q2.21 CALENDAR_QUARTER 36815657 36154815 Q3.21 CALENDAR_QUARTER 32318935 32318935 Q4.21 CALENDAR_QUARTER 34848911 32318935 JAN-21 MONTH 13119235 13119235 FEB-21 MONTH 11441738 11441738 MAR-21 MONTH 11593842 11441738 APR-21 MONTH 11356940 11356940 MAY-21 MONTH 13820218 11356940 JUN-21 MONTH 11638499 11356940 JUL-21 MONTH 9417316 9417316 AUG-21 MONTH 11596052 9417316 SEP-21 MONTH 11305567 9417316 OCT-21 MONTH 11780401 9417316 NOV-21 MONTH 10653184 9417316 DEC-21 MONTH 12415325 9417316
Parallel Period
Parallel periods are at the same level as the current time period, but have different parents in an earlier period. For example, you may want to compare current sales with sales for the prior year at the quarter and month levels.
The Data Analysis tool provides several functions for parallel periods:
-
Parallel Period: Calculates the value of the parallel period.
-
Difference From Parallel Period: Calculates the difference in values between the current period and the parallel period.
-
Percent Difference From Parallel Period: Calculates the percent difference in values between the current period and the parallel period.
To identify the parallel period, you specify a level and the number of periods before the current period. You can also decide what happens when two periods do not exactly match, such as comparing daily sales for February (28 days) with January (31 days).
You also choose the measure, the time dimension, and the hierarchy.
Parallel Period Example
This template defines a calculated measure using Parallel Period.
Parallel period for SALES in the TIME dimension and TIME.CALENDAR hierarchy 1 TIME.CALENDAR.QUARTER ago based on position from beginning to ending of period.
These are the results of a query against the calculated measure, which lists the months for two calendar quarters. The parallel month has the same position within the previous quarter. The prior period for JUL-21
is APR-21,
for AUG-21
is MAY-21
, and for SEP-21
is JUN-21
.
TIME PARENT SALES LAST_QTR -------- ---------- ---------- ---------- APR-21 CY2006.Q2 11356940 13119235 MAY-21 CY2006.Q2 13820218 11441738 JUN-21 CY2006.Q2 11638499 11593842 JUL-21 CY2006.Q3 9417316 11356940 AUG-21 CY2006.Q3 11596052 13820218 SEP-21 CY2006.Q3 11305567 11638499
Moving Aggregates
Moving aggregates are performed over the time periods surrounding the current period.
The Data Analysis tool provides several aggregation methods for moving calculations:
-
Moving Average: Calculates the average value for a measure over a fixed number of time periods.
-
Moving Maximum: Calculates the maximum value for a measure over a fixed number of time periods.
-
Moving Minimum: Calculates the minimum value for a measure over a fixed number of time periods.
-
Moving Total: Returns the total value for a measure over a fixed number of time periods.
You can choose the measure, the time dimension, and the hierarchy. You can also select the range, as described in "Choosing a range of time periods" in Oracle OLAP User’s Guide , and the number of time periods before and after the current period to include in the calculation.
Moving Aggregates Example
This template defines a calculated measure using Moving Minimum.
Moving minimum of SALES in the TIME dimension and TIME.CALENDAR hierarchy. Include 1 preceding and 1 following members within level.
These are the results of a query against the calculated measure, which displays values for the descendants of calendar year 2021. Each value of Minimum Sales is the smallest among the current value and the values immediately before and after it. The calculation is performed over all members of a level in the cube.
TIME TIME_LEVEL SALES MIN_SALES -------- -------------------- ---------- ---------- Q1.21 CALENDAR_QUARTER 32977874 32977874 Q2.21 CALENDAR_QUARTER 35797921 32977874 Q3.21 CALENDAR_QUARTER 33526203 33526203 Q4.21 CALENDAR_QUARTER 41988687 31381338 JAN-21 MONTH 11477898 10982016 FEB-21 MONTH 10982016 10517960 MAR-21 MONTH 10517960 10517960 APR-21 MONTH 11032057 10517960 MAY-21 MONTH 11432616 11032057 JUN-21 MONTH 13333248 11432616 JUL-21 MONTH 12070352 11108893 AUG-21 MONTH 11108893 10346958 SEP-21 MONTH 10346958 10346958 OCT-21 MONTH 14358605 10346958 NOV-21 MONTH 12757560 12757560 DEC-21 MONTH 14872522 12093518
Share
Share calculates the ratio of a measure's value for the current dimension member to the value for a related member of the same dimension.
You can choose whether the related member is:
-
Top of hierarchy: Calculates the ratio of each member to the total.
-
Member's parent: Calculates the ratio of each member to its parent.
-
Member's ancestor at level: Calculates the ratio of each member to its ancestor, that is, a member at a specified level higher in the hierarchy.
When creating a share calculation, you can choose the measure, dimension, and hierarchy. You also have the option of multiplying the results by 100 to get percentages instead of fractions.
Share Example
This template defines a calculated measure using SHARE
:
Share of measure SALES in PRODUCT.PRIMARY hierarchy of the PRODUCT dimension as a ratio of top of hierarchy.
These are the results of a query against the calculated measure. The TOTAL_SHARE
column displays the percent share of the total for the selected products.
PRODUCT PROD_LEVEL SALES TOTAL_SHARE -------------------- --------------- ---------- ----------- Total Product TOTAL 144290686 100 Hardware CLASS 130145388 90 Desktop PCs FAMILY 78770152 55 Portable PCs FAMILY 19066575 13 CD/DVD FAMILY 16559860 11 Software/Other CLASS 14145298 10 Accessories FAMILY 6475353 4 Operating Systems FAMILY 5738775 4 Memory FAMILY 5430466 4 Modems/Fax FAMILY 5844185 4 Monitors FAMILY 4474150 3 Documentation FAMILY 1931170 1
Rank
Rank orders the values of a dimension based on the values of the selected measure. When defining a rank calculation, you choose the dimension, a hierarchy, and the measure.
You can choose a method for handling identical values:
-
Rank: Assigns the same rank to identical values, so there may be fewer ranks than there are members. For example, it may return
1
,2
,3
,3
,4
for a series of five dimension members. -
Dense Rank: Assigns the same minimum rank to identical values. For example, it may return
1
,2
,3
,3
,5
for a series of five dimension members. -
Average Rank: Assigns the same average rank to identical values. For example, it may return
1
,2
,3.5
,3.5
,5
for a series of five dimension members.
You can also choose the group in which the dimension members are ranked:
-
Member's level: Ranks members at the same level.
-
Member's parent: Ranks members with the same parent.
-
Member's ancestor at level: Ranks members with the same ancestor at a specified level higher in the hierarchy.
Rank Example
This template defines a calculated measure using Rank:
Rank members of the PRODUCT dimension and PRODUCT.PRIMARY hierarchy based on measure SALES. Calculate rank using RANK method with member's parent in order lowest to highest. Rank NA (null) values nulls last.
These are the results of a query against the calculated measure in which the products are ordered by RANK
:
PRODUCT SALES RANK -------------------- ---------- ---------- Monitors 4474150 1 Memory 5430466 2 Modems/Fax 5844185 3 CD/DVD 16559860 4 Portable PCs 19066575 5 Desktop PCs 78770152 6
Analyzing data
The output display pane for an Analytic View enables you to Analyze the data from Analytic View.
- Analyze tab- In this tab, you select Hierarchy Levels and Measures from the Analytic View to analyze the data.
- Data Quality tab- This tab displays structural errors in the table data and dimension sources for the Analytic View.
- Export tab- This tab exports the Analytic View you create to different tools available for better visualization.
Analyze tab
The Analytic View Browser displays the Hierarchies, Levels and calculated measures generated with the selected Analytic View. You can drag and drop Levels and Measures from the Analytic View browser to the drop area in Columns, Rows or Values and Filters in the output pane of Analyze tab. The Rows and Columns are interchangeable. The values should be Analytic View measures.
Drag and drop measures to the filter area in the Analyze tab. After you drop the selected measure to the drop area, a faceted search window appears.
You can analyze filtered and refined searches in the output by dragging and dropping multiple measures in the filter area. It helps you drill down to the values you are looking for.
Choose one of the two options in the top-right of the dialog box to set the mode of display on the window.
Click List View to display the filter condition in two columns. The left column is the search column in which you can drill down to the specific value in the measures. You can select multiple values from the complete list of values displayed in the left column. The right column shows the values you have selected from the list.
Click Multi-Select view to display the search condition as a single column. Click Add Filter to view the complete list of values. You can select multiple values from this list.
Click the display or hide funnel icon to open faceted search list.
The Faceted search list consists of measures and the count next to each value displays the total number of items that fit the category. You can click on attributes of the measures that apply as a filter to your search that further narrows the search down.
Choose one of the three options in the top-right of the dialog box to view the result of the query in the appropriate mode. The modes of display are Table view, Pivot view and Chart view.
Click the SQL icon on the display area to view the SQL query of the filter condition. The worksheet editor page appears.
Click the Run Query icon to execute the statements in the worksheet editor. The area beneath the SQL worksheet editor displays the results of the search condition that match the filter criteria.
After creating an Analytic View, you can use it to analyze its data in different formats. You can choose from different visualization formats such as pivot, table or chart. These are generated based on the levels and measures you select. You can analyze the data in pivot, table and chart forms by selecting their respective icons displayed in the right corner. These are generated based on the levels and measures you select.
You can add totals to the pivot table data. This Total value is created as an additional row and an additional column. The tool automatically calculates the aggregate value based on the values, rows, and columns you drop from the Analytic View browser to the drop area.
The grand total values are displayed at the end of the total row and total column. Based on the grouping of data, the grand total values are further broken down into sub-total values.
This helps in comparing values and summarizing data which further helps to gain insights from the different sets of data you select.
The Related Insights panel displays the generated graphically based on measures selected to visualize the data. It is designed in such a way that it could trigger immediate insights.
Data Quality tab
This tab helps you measure the total number of structural errors in the Analytic View you create. For example, null values in a join column is an error. In addition to being a join column, this error will be signaled if there is a null value in the detail level of a hierarchy. This way you can resolve the errors and enhance the quality of the data. This tab displays the fact table and dimensions along with the associated number of errors. Click the triangular icon on the box with errors to expand the list to display first five rows with that specific error as a sample. The errors are categorized based on dimensions and fact tables.
Click the Download icon to view all errors as a CSV file.
Select the cards to view which category the errors belong to. Select Analyze icon to switch the view back to Analyze tab.
Export tab
Note:
- OAC has in-built tools to search and utilize Analytic Views.
-
You need to install the Oracle Database client on Windows operating system to export the data to Microsoft Power BI. Oracle provides 32-bit and 64-bit versions of Oracle Database Client for Windows. Oracle certifies 32-bit Oracle Database Client running on Windows x64 only. Follow the instructions mentioned in this link to install 64-bit ODAC 19.3.
This allows anyone to connect to data, visualize and create interactive dashboards in a few clicks.
Oracle Autonomous Database Add-in for Excel
The Oracle Autonomous Database Add-in for Excel integrates Microsoft Excel spreadsheets with the Autonomous Database to retrieve and analyze data from Analytic Views in the database. You can run custom SQL queries and view their results in the worksheet.
Install the Oracle Autonomous Database add-in on Mac
The Oracle Autonomous Database add-in for Excel is supported on Mac OS running Microsoft Office 365.
Before you can install the Autonomous Database Add-in for Excel, download the oracleplugin.zip file and extract it to get the installer script file from your Database Actions instance.
-
Open the Database Actions Launchpad.
- On the right of the launchpad page, in the Getting Started panel, click the Download link present below the Add-in for Excel Spreadsheet link.
- You can now view a zipped folder in the Downloads folder of your system.
- Create a new folder named Add-in in your Downloads folder.
- Extract the zipped folder in the Add-in folder.
Follow these steps to install the add-in.
- Quit Excel before you run the installer.
- Double-click the install.sh file that you downloaded previously.
- Right click on install.sh and select the following options as shown : Open With -> Other… -> Enable: All Applications ->Utilities->Terminal
- Start Excel and open a new or existing workbook.
- From the Insert menu in the Excel ribbon, select drop-down menu of My Add-ins.
A new Oracle Autonomous Database entry appears under Developer Add-Ins dialog box.
- Select Oracle Autonomous Database.
A new Autonomous Database ribbon tab appears in MS Excel.
Install the Oracle Autonomous Database add-in on Windows
The Oracle Autonomous Database Add-in for Excel is supported on Windows 10 operating systems running Microsoft Excel 365.
Before you can install the Autonomous Database Add-in for Excel, download the oracleplugin.zip file and extract it to get the install.cmd script file from your Database Actions instance.
-
Open the Database Actions Launchpad.
- On the right of the launchpad page, in the Getting Started panel, click the Download link present below the Add-in for Excel Spreadsheet link.
- Extract the oracleplugin.zip folder to a new folder in the Downloads of your system. The extracted folder consists of an installer (install.cmd file), a manifest.xml file and a readme.txt file.
Follow these steps to install the add-in.
- Quit Excel before you run the installer.
- Right-click the install.cmd file that you downloaded.
Note:
After running the installer on Windows, the add-in automatically creates a network share and adds the shared location as a trusted catalog location for Office add-ins. A catalog is used to store the manifest for the Excel Add-in. It enables publishing and management of the Excel add-in as well as other add-ins that are available in the Office Store and licensed for corporate use. You can acquire the Excel add-in by specifying the shared manifest folder as a trusted catalog.
- Select Run as administrator.
Note:
You must have Administrator privileges to successfully install the Excel add-in for Oracle Autonomous Database. - Start Excel and open a new or existing workbook.
- After you install the add-in, a new Autonomous Database ribbon tab appears in MS Excel.
Note:
You can change the functionality of the installer after initial installation. Re-run the installer and choose the option of your preference. You can either choose to repair your existing installation by deleting it and selecting the installed trusted catalog or adding another manifest to the working installation.
Uninstall the Oracle Autonomous Database add-in
The following section describes the steps to uninstall the Oracle Autonomous Database add-in.
To uninstall the Oracle Autonomous Database Add-in for Excel for Windows:
- Delete the manifest.xml file from the Add-in folder in your Downloads located on your PC.
- Click Refresh in the Office Add-ins window to remove the Autonomous Database tab from MS Excel.
No add-ins will now be available from the Shared folder of the Office Add-ins window.
To uninstall the Oracle Autonomous Database Add-in for Excel for Mac:
- Enter the following command in the terminal to remove the manifest.xml file.
rm ~/Library/Containers/com.microsoft.Excel/Data/Documents/wef/manifest.xml
The Oracle Autonomous Database Add-in is uninstalled from Excel for Mac.
Note:
After uninstalling the Add-in, if you re-install it from different Autonomous Database (ADB) then the add-in attempts to load the old ADB. You need to then check if the location (share path) of the shared manifest folder is pointing to the right location. Refer to Configuring the Excel Trusted Add-in Catalog in FAQs for Troubleshooting errors with Excel Add-in chapter for more details.
Using Oracle Autonomous Database Add-in for Excel
After you install the add-in, a new ribbon tab, Autonomous Database appears in MS Excel.
You can sign in to the Autonomous Database, work with Analytic Views and view the data in the worksheet.
This ribbon provides buttons that lets you connect to the Autonomous Database.
The Sign In icon controls access to the database. Click Sign In to integrate the Autonomous Database with the Excel worksheet. After you sign in, the About icon, the Native SQL icon, and Query Wizard icons are enabled.
Click About to view the Add-in and the supported excel versions. The About window also displays whether the spreadsheet is connected to the database or not. It also displays version information for the database and Oracle Rest Data Services.
Click Native SQL to write and run custom SQL queries.
Click Query Wizard to select the Analytic View you want to query. You can review and edit the query, add or edit filters and calculations to it and choose the output format from tabular and pivot formats.
Selecting Native SQL icon or Query Wizard icon from the ribbon launches the Oracle Autonomous Database wizard in the Excel task pane.
Click Move in the drop-down of the wizard pane to move the wizard to your preferred location.
The Resize option in the drop-down resizes the query window. As you select this option, you can resize the wizard window by moving the double-headed arrow sideways. The wizard expands when you move the arrow to the left and it contracts when you drag it to the right.
Click Close to close the wizard.
Run native SQL queries in an Excel worksheet
The Oracle Autonomous Database add-in for Excel lets you run native SQL queries to work with your data in an Excel worksheet.
With the add-in, you can create a table and insert, update and delete rows from the existing table. You can view the results in the existing worksheet or in a different worksheet.
The following image shows your data retrieved from the Autonomous Database and displayed in the worksheet. The Query Info section comprising the Timestamp, User name and SQL Query are shown in Excel. You can edit custom queries, run them, query Analytic Views, and add or edit filters to the Analytic View. The worksheet displays the results of queries in tabular format from the retrieved data.
The add-in maintains a live connection with the database. However, the data retrieved is local to Excel. In case of inactivity, the connection times out, and you will need to log in again. The image shows the results from a single query, but you can insert many queries in a single worksheet.
To run a query using the add-in, run Excel and create a blank workbook using the standard Excel workbook file format.
- In the Excel ribbon, select the Autonomous Database.
- Click the Native SQL icon from the ribbon. This opens an Oracle Autonomous Database dialog box in the Excel Task Pane.
- Write a query in the SQL query editor.
- Click Execute to run the query results in the worksheet. You can click + sign besides the Select worksheet drop-down to display the results in a new worksheet.
- The worksheet also displays information such as the timestamp and the user who creates and runs the query.
To run another query follow these steps:
- Clear the previous query from the SQL editor and write the new query.
- In the Select worksheet drop-down, select a new sheet, Sheet 2 in this case. The Add-in adds a sheet for the user. If you choose to work on the same sheet, the Add-in refreshes the data in the existing worksheet.
- Click Execute to display the query results.
The worksheet displays the result of the query at a go. While this behavior works for most scenarios, sometimes, for large data sets, the query result might exceed 10K rows. Although you can view the 10K rows, a confirmation window appears which asks if you would want to view the rest of the result.

Description of the illustration adp-entire-result-set.jpg
Select Yes to view the entire result set. Loading the entire data may take a while. You must fetch the entire query result before working with Pivot tables, or else it will lead to incorrect results from aggregation in Pivot tables.
Close the Query Wizard panel to cancel the operation of fetching the result.
Note:
Close the Query Wizard panel to cancel the operation of fetching the result.Query an Analytic View in an Excel worksheet
The Query Wizard menu enables you to query an Analytic View and retrieve the results in an Excel Worksheet. Once the wizard copies and retrieves the data, it becomes local to Excel. You can further edit the data in Excel but cannot write back to the Autonomous Database.
You can retrieve the Analytic View to visualize the result data in the worksheet. You can search for the Analytic View, select measures, hierarchies, and levels from the query. You also have options to add filters and calculated measures to the query and view the query result in the spreadsheet.
By default, the data is retrieved in tabular format. You also have the option to create an Excel pivot from this data.
The Query Wizard has three panels:
- Analytic View panel:The Analytic View panel contains a list of analytic views from which you build queries. You edit the query by selecting measures, hierarchies and levels and progress to the next panel.
- Filter panel:The Filter panel displays to the right of the Analytic View panel. You can create filter conditions and add calculations to the query in this panel.
- Query Result panel:The Query Result panel displays to the right of the Filter panel. Once you select the filter criteria and determine what calculated measures to add to your query, you run the query. You can view and revise the SQL query. After the SQL query runs, you view the query results in the worksheet. You can select the output format of the result here. You can view the results in tabular format or the form of a Pivot table.
To query an analytic view and explore the Query Wizard menu in the MS Excel ribbon:
- On the ribbon, select the Query Wizard icon.
- Selecting the Query Wizard opens an Oracle Autonomous Database dialog box in the Excel Task Pane.
- Select an existing Analytic View from the drop-down in the Analytic View pane. As you select the Analytic View, it appears on the Analytic View field.
- Select your choice of measures, hierarchies, and levels from list of available measures, hierarchies and levels associated with the Analytic View. Click Next.
- The wizard window progresses to the Filter pane where you can add or edit filters to query.
- Under Add or Edit filter conditions, do the following.
- Select the column name and the attribute name from the drop-down. The values of the attribute change dynamically with the change in column names.
- Select an operator in the Operator field to apply to the values that you specify in the Value field.
- Specify a value or values from the list that contains members of the column that you select. You need to enter the value into the Values field manually. For example, you can select > in the Operator field to use only values greater than the value that you select in the Value list. If you select 100,000 from the Value list, then the filter uses values from the column that are greater than 100,000. You can use this information in an analysis to focus on products that are performing well.
- Click Add Filter to add another filter condition.
- Under Add or Edit Calculations, do the following.
- Specify the column whose values you want to include in the group or calculated item.
- On the Calc expression field, enter a custom calculated expression you want to perform on the column value. You can add functions or conditional expressions.
- Click Next to progress to the Query Result.
- You can view, edit, and review the query you have generated from the Query Review editor.
- Select Remove empty columns to remove empty columns from the result.
- Select Column per level to retrieve all levels of a hierarchy in a single column.
- Select the worksheet from the drop-down where you want to view the result.
- Click Execute to run the query.
- You can view the result of the query in the worksheet you select.
- You can always modify the query in the Oracle Autonomous Database dialog box editor even after results are generated.
- Select Table in the Query Result pane to view the results in the worksheet in a tabular format.
- Select Pivotin the Query Result pane to view the results in the worksheet in Pivot format.
View the results in Pivot tables
Pivot table view is an interactive view that allows you to transpose rows and columns. A pivot table can summarize, sort, reorganize, count total and perform average of the result data. They are navigable and drillable.
Apart from tabular mode, to view the query results in pivot table mode, select the Pivot Table option in the Autonomous Database wizard. Click Execute to view the query results in Pivot table.
Clicking Execute opens the query results in a new sheet with a PivotTable Fields wizard. Click anywhere outside the table in the spreadsheet to switch the Pivot Table wizard to Native SQL query wizard. Select any cell in the table to continue editing the Pivot Table fields.
You can view the Grand Total of the entire pivot table in the last row of the table.
Work with the PivotTable Fields wizard
This topic describes what you need to know to work with the PivotTable Fields wizard.
You can edit the pivot tables in different ways to display data the way you want. You use drop targets to modify the way data is arranged in a data view by dragging and dropping columns to different targets within the view.
For example, you can edit a pivot table in an analysis by dragging the month field to the rows area, the sales field to the Values area and the year name to the Columns area to display its corresponding sales for each month and year.
You can add filters in the Filters area to limit the data in your worksheet.
If you want to remove a field from the pivot table analysis, click on the field you want to remove and select Remove Field.
To select the type of calculation you want to summarize the data, select the appropriate option from the Values field. The different types of calculations you can perform on the Values field are sum, count, average, maximum, and minimum.
You can customize the appearance of Fields section and Areas section in the Pivot Table Fields wizard. To change the way you want to view the Fields section and the Areas section, select the Tools icon in the Pivot Table Fields wizard.
Edit Query Results in the worksheet
Oracle Autonomous Database add-in automatically manages the appearance of an integrated Excel workbook through built-in styles and data format types.
Once the plug in runs the query and retrieves the data into the worksheet, you can view the details of the plug-in’s automatically generated query results by hovering over each cell of the workbook.
Sorting the data
When you are working with a lot of data in the worksheet, you need to sort it to optimize your view.
Right click the cell you want to sort, go to Sort and select a sorting option (for example, Sort Oldest to Newest and Sort Newest to Oldest).
Drilling the data
Many of the results in the worksheet represent hierarchical data structures. The metadata specifies these hierarchies, and this enables you to access the different levels of detail within them. Drilling is a way to navigate through data in views quickly and easily.
- Drill down to display data in more detail, which displays more members.
- Drill up to display less data.
When you drill down in a table, the detail level data is added to the current data.
For example, when you drill from a month, the table displays data for the month and for the days in that month.
- Hover over the cell in the spreadsheet which contains + sign.
- Click the + sign besides the member you want to drill.
The details are added to the pivot table.
You can now create, manage, and run queries directly with the analytic views in the autonomous database and create powerful data driven reports.
FAQs for Troubleshooting errors with Excel Add-in
If you experience issues with Oracle Autonomous Database Add-in for Excel refer frequently asked questions mentioned in this section to identify and resolve issues.
Why is the My Add-ins icon from the Insert ribbon in the MS Excel workbook greyed out?
Even before installing the Excel add-in, sometimes the My Add-ins icon from the Insert ribbon in the MS Excel workbook appears to be greyed out.
- From the File menu in Excel ribbon, go to Account and select Manage Settings from the Account page.
- Ensure that you select the Turn on optional connected experiences.
- From the File menu in Excel ribbon, go to Options and select the Trust Center option from Excel Options.
- Click Trust Center Settings and ensure that you deselect Disable all Application Add-ins (if selected) from the Add-ins tab in the Trust Center dialog box.
- Select the Trusted Add-in Catalogs menu from the Trust Center dialog box and ensure that you deselect the Don’t Allow any web add-ins to start checkbox.
Why doesn’t the sign-in page of the Excel Add-in load or appear?
At times you might encounter issues with the Excel Add-in even after it is loaded correctly. For example, an add-in fails to load or is inaccessible. Check the compatibility version of the Excel and the operating system you use.
If the compatibility is correct and the sign-in page to the Excel Add-in still does not show up, or it does not load properly, we recommend applying all pending Windows, Office, and browser updates.
- From the Windows Start menu, select Settings, Update & Security, and then Windows Update.
- If updates are available on the Windows Update page, review the updates and click Install Now.
Note:
The details of applying Windows updates can vary from version-to-version and if required, check with your system administrator for assistance.
Why doesn’t the add-in work correctly after re-installing?
Configure the Excel trusted Add-in catalog to set the add-in correctly after re-installation.
To configure the Excel add-in, check or remove the add-in if it is pointing at a wrong location in the Trusted catalog address. This address should be the same as the location (share path) of the shared manifest folder.
Click Excel’s File> More> Options>Trust Center >Trust Center Settings> Trusted Add-in Catalogs
Description of the illustration adp-trusted-catalogs.png
Checking is only required the first time you use the installer, or if the shared manifest folder is changed. The change occurs during uninstalling and re-pointing to a new ADB.
- Select the Catalog you want to remove from the trusted catalog table and click Remove.
- Enter the correct share path of the shared manifest folder in the Catalog url field and click Add catalog to add the shared folder to trusted catalog.
Restart Excel to make the new shared folder active to access the add-in.
Why doesn’t the add-in work correctly even after configuring the Excel trusted Add-in catalog?
Let’s say you configure the Excel trusted add-in catalog after re-installing the add-in but even then, it does not load correctly. Sometimes the database server changes are not reflected in Excel even after you set the share path of the shared manifest folder as a trusted add-in catalog. Clear the Office cache to resolve this issue.
Refer to this page https://docs.microsoft.com/en-us/office/dev/add-ins/testing/clear-cache#clear-the-office-cache-on-windows to clear the Office cache on Windows and Mac.
Clearing the Office cache unloads the Excel add-in. Install the add-in and check the configuration of the Excel trusted add-in catalog. This should solve the issue of incorrect loading of the Excel add-in.
Oracle Autonomous Database add-on for Google Sheets
The Oracle Autonomous Database add-on for Google Sheets enables you to build Google Sheets based on the data in the Autonomous Database
The data retrieved from the Autonomous Database is available locally in Google Sheets for further analysis. The results are stored in the local copy and cannot be written back to the Autonomous Database. You can run custom SQL queries or query Analytic Views and view their results in the worksheet. The add-on allows you to apply filter to the query results and perform calculations and joins on them.
How does the add-on for Google Sheets work?
Oracle Autonomous Database add-on for Google Sheets works with the Analytic Views you create in the Autonomous Database.
To query an Analytic View from the Autonomous Database, you must select an Analytic View to work with. While retrieving data from the Analytic View, you can configure the query according to your requirements. You can select specific hierarchies and create your own calculations on the wizard. The add-on configures your query and returns the result to the Google Sheets. You can save the results of your queries locally in the Google Sheet. The add-on can also be used to query the schema directly to which you have access.
You need to enable Web Access on Autonomous Database account to use the add-on. You must have the CONNECT, DWROLE, and RESOURCE roles granted in the SQL worksheet to access the Google Sheets add-on.
Install the Oracle Autonomous Database add-on for Google Sheets
Before you can install the Oracle Autonomous Database add-on for Google Sheets, download the oracleGoogleAddin folder from your Database Actions instance.
Open the Database Actions Launchpad. On the right of the Database Actions page, in the Getting Started panel, click the Add-on for Google Sheets link. To use Oracle Autonomous Database add-on for Google Sheets, extract the zipped oracleGoogleAddin folder to a new oracleGoogleAddin folder on your desktop.
This folder consists of Code.gs, About.html, CodeSuccess.html, QueryWizard.html, Register.html, RegisterStyle.html, SQLClientJS.html, SQLIndex.html, WizardClientJS.html, WizardStyle.html and README.md files.
For installing the Oracle Autonomous Database add-on for Google Sheets, you need to import the files in the oracleGoogleAddin folder to Google Apps Script. These steps are typically performed by an IT administrator for the end users to use the Add-on. The following are the methods to import the files.
- Import oracleGoogleAddin files to Google Apps Script manually: You can manually copy and paste these files to Apps Script.
- Upload oracleGoogleAddin files to Apps Script using clasp: You can alternatively upload files to App Script using Clasp. It is preferable to use Clasp to upload the files because it saves you time rather than having to perform the task manually.
After you import or upload the files to Google Apps Script follow these steps to complete the installation of Oracle Autonomous Database add-on for Google Sheets:
Import oracleGoogleAddin files to Google Apps Script manually
To manually import the files in this folder, you must copy and paste all the HTML code into the Apps Script editor.
-
Enter sheet.new in the address bar of the web browser to open Google Sheet. Make sure you are logged in with your Google account.
-
On the Extensions menu, select Apps Script. This opens an Apps Script editor window with URL starting with https://script.google.com/. You require the Google Apps Script to access the Autonomous Database and work with your Google Sheets. Run the scripts present in the oracleGoogleAddin folder in the Apps Script editor.
-
Click on the default name Untitled project. A window pops up where you enter the name you wish to use. Click on the Rename button to rename it.
-
Select the Code.gs file in the Apps Script editor. The Code.gs file exists in the editor window by default. Replace the existing code in the editor with the code in the Code.gs file. It is the same file present in the oracleGoogleAddin folder.
Description of the illustration add-html.png -
Click Add a file and select HTML from the drop-down. Rename the HTML file to QueryWizard which is the same name as the file you downloaded. Replace the existing code in the newly created HTML file with the code in the QueryWizard.html. You can find this file after extracting the oracleGoogleAddin zipped folder.
-
Repeat the above step to create the rest of the HTML files that are, About.html, CodeSuccess.html, QueryWizard.html, Register.html, RegisterStyle.html, SQLClientJS.html, SQLIndex.html, WizardClientJS.html, and WizardStyle.html.
Description of the illustration html-files.png -
Click the Refresh button once you have added all the files. You can now view a new menu Ask Oracle in the Google Sheet.
Description of the illustration ask-oracle-menu.png
Upload oracleGoogleAddin files to Google Apps Script using Clasp
To alternatively upload all the files present in the oracleGoogleAddin folder, you must use Command Line Apps Script Project (clasp).
Note:
Clasp is written in Node.js. and distributed via the Node Package Manager (NPM) tool. It is required to install Node.js version 4.7.4 or later to use clasp.- After you install Node.js, enter the following npm command in the command prompt to install clasp. You must enter this command in the location where you have downloaded and extracted the oracleGoogleAddin folder. In this case, we have the extracted folder named oracleGoogleAddin in the Desktop.
C:\Users\username>cd Desktop C:\Users\username\Desktop>cd oracleGoogleAddin C:\Users\username\Desktop\oracleGoogleAddin>npm install @google/clasp -g
To run the command as an administrator for UNIX- and Linux-based systems, enter the following command:
sudo npm install @google/clasp -g
After you install clasp, the clasp command is available to use from any directory on your computer.
- Enter the following command to login and authorize management of your Google account's Apps Script projects.
clasp login
Once this command is run, the system launches the default browser and asks you to sign into your Google account where your Google Apps Script project will be stored. Select Allow for clasp to access your Google Account.
It returns the following output:
Authorization successful. Default credentials saved to: C:\Users\username\.clasprc.json.
- Enter this command to create a new project in the current directory with an optional project title.
clasp create [google_sheet]
The above command returns the following output.
? Create which script? standalone docs > sheets slides forms webapp api
Use the arrows in your keyboard to select sheets.
This command also creates a .clasp.json file to store the script ID and an appsscript.json file that contains the project metadata.
After successful creation of the google script, it displays the results in the command line:Created new Google Sheet: https://drive.google.com/open?id=xxxxxxxxxxxxxxxxxxxxxxxxxxxxx Created new Google Sheet Add-on script: https://script.google.com/d/
Note:
If you have not enabled the Apps Script API in Google Apps Script, the above command will not be successful. Enable the API by visiting https://script.google.com/home/usersettings site and selecting the On button.You can view the new Google sheet in your Google Sheets page. To verify if the sheet is created using the script, see the Last opened by me time. It should display the current time.
- Push all the files from your folder to the Google Apps Script files by specifying the following command:
clasp push
This command uploads all of the script project's files from your computer to Google Apps Script files.
- Go to the newly created Google Sheet and click on the Extensions menu and select Apps Script. Under Files, you can view all the files present in the oracleGoogleAddin folder.
- Click the Refresh button once you have uploaded all the files. You can now view a new menu Ask Oracle in the Google Sheet.
In case you wish to clone an existing Google Script project, you will require a Script ID. To find the Script ID:
- Open the existing Google Apps Script project.
- Click Project Settings in the left pane.
- Click Copy to Clipboard to copy the Script ID under IDs.
- Specify the following command in command prompt:
clasp clone <scriptId>
- Specify this command to download the Google Apps Script project from your Google Drive to your local system.
clasp pull
- To upload all the files from your local to your Google Apps Script, enter this command.
clasp push
Deploy the Google script as a web app
After all the files from the oracleGoogleAddin folder are imported or uploaded to the Google Apps Script files, you must deploy the Google script as a web app.
- Click on the Extensions menu in the Google Sheet you are working on and select Apps Script. This opens the window.
- Click Deploy button on the top right and select New deployment. A New deployment window opens.
- Next to Select type, click Enable deployment types and select Web app.
- Under Configuration, specify Description of the deployment in the Description field. For example, Web app deployment.
- Under Web app in the New deployment window, select your Google account that you have used to login from the Execute as drop-down.
-
Select Deploy.
Note:
- If you receive a window which asks you to Authorize access, click Continue. This will redirect you to the Google accounts page where you need to select your Gmail account.
- Click Advanced and select the Go to Untitled project (unsafe) link.
- Selecting the link opens a new window which ensures that you trust the application. Click Allow to continue.
If you Authorize access at this stage, you need not follow steps 2-4 in the Authorize Google Sheets to use Autonomous Database.
https://script.google.com/macros/s/AKfycbwFITvtYvGDSsrun22g7TrbrfV-bUVoWKs7OrA_3rtRAlmcGFe8bejNprZML7gFPzQ/exec
This is the Web application deployment URL.
You require the web application deployment URL while obtaining the Client ID and Client Secret keys during OAuth authentication.
Create Connections with Google Sheets
The add-on connects to Google Sheets by providing authentication to Google.
To access the Oracle Autonomous Database for Google Sheets, you use the OAuth credentials. You can access Autonomous Database using OAuth authentication. You will need the OAuth Client ID and OAuth Client Secret values to authenticate and authorize Google Sheets to use the Autonomous Database.
The above methods require a web application deployment URL. You obtain this URL when you deploy a Google Script as a web app.
Generate Client ID and Client Secret using SQL Command
Use SQL commands in SQL worksheet in Database Actions to generate the OAuth Client ID and OAuth Client Secret values.
-
Log in to Database Actions as the user setting up to use OAuth authentication to connect from Google Sheets.
Note:
You must have the CONNECT, DWROLE, and RESOURCE roles granted in the SQL worksheet. - Click the hamburger icon in the Database Actions page to view all the available actions.
- Select SQL under Development menu.
-
In the SQL worksheet editor, specify a set of SQL commands to register the Oauth Client.
Here is a sample of the SQL commands where you fill in appropriate values based on your user, your client application and the web application deployment URL you generate.BEGIN OAUTH.create_client( p_name => 'my_client', /* Name of the Client*/ p_grant_type => 'authorization_code', p_owner => 'my_schema_name', /* Name of the Schema */ p_description => 'A client for my SODA REST resources', p_support_email => 'user_name@example.com', p_privilege_names => 'my_priv', p_redirect_uri => 'my_redirect_url', /* Web application deployment URL */ p_support_uri => 'my_support_url' /* https://script.google.com/ */ ); OAUTH.grant_client_role( p_client_name => 'my_client', p_role_name => 'SQL Developer' ); OAUTH.grant_client_role( p_client_name => 'my_client', p_role_name => 'SQL Developer' ); COMMIT; END;
Note:
p_owner (Name of the Schema) and p_redirect_uri (Web application deployment URL) are mandatory fields.
- Click Run Script in the SQL Worksheet toolbar to run the commands.
- The Script output displays that the process is successful. The above script registers a client named
my_client
to access themy_priv
privilege using OAuth client credentials. - Obtain the
client_id
andclient_secret
required by specifying the following command:SELECT id, name, client_id, client_secret FROM user_ords_clients;
You can view the client_id
and client_secret
values of your client (my_client ) in the Query Result tab of the output pane.
Generate Client ID and Client Secret using UI
You can obtain the client_id
and client_secret
values using the UI.
You generate the client keys by accessing the Autonomous Database instance URL appending with oauth/clients.
For example, if your instance is "https://localhost:port/ords/schemaName", you need to sign in to the link "https://localhost:port/ords/schemaName/oauth/clients/" to generate new client. Be sure to include the trailing slash.
- Sign in to Database Actions with "https://machinename.oraclecloudapps.com/ords/SchemaName/oauth/clients/" link. You can view an OAuth Clients page.
- Click New Client button to create a new client.
- Enter the following fields. The fields with an asterisk (*) are mandatory:
- Name: Name of the client.
- Description: Description of the purpose of the client.
- Response Type: CODE
- Allowed Origins: Add the list of URL prefixes.
- Support URI: Enter the URI where end users can contact the client for support. Example: https://script.google.com/
- Logo: Select an image from your local system to insert a logo for your new client.
- Flow: AUTH_CODE
- Redirect URI: web application deployment URL
- Support Email: Enter the email where end users can contact the client for support.
- Required Privileges: Select privileges that the client wants to access. This value may vary as per your requirements.
- Select Create New Client. This registers the OAuth Client which you can view on the OAuth Clients page.
- Click the Edit icon besides the client name to view
client_id
andclient_secret
values.
The Client Identifier value is the client_id
and the Client Secret value is the client_secret
value.
Authorize Google Sheets to use Autonomous Database
After your identity is determined using OAuth authentication, Google Sheets needs permission to access the Autonomous Database.
The client_id
and client_secret
values you generate during OAuth authentication is used for authorization.
- Click on the Ask Oracle menu in the Google Sheet you are working on and select Register. This requires one time Google authentication.
- Clicking Register opens a pop-up window which asks your permission to run the authorization. Click Continue. Selecting Continue will redirect you to the Google Accounts page where you need to select your Gmail account.
- You will now view a window which informs you that the application requests access to sensitive information in your Google account. Click Advanced and select the Go to Untitled project (unsafe) link.
- Selecting the link opens a new window which ensures that you trust the application. Click Allow to continue.
- You have now completed the setup. Select Register from Ask Oracle menu in the Google sheet.
This opens an Oracle Autonomous Database wizard in the Google sheet. Specify the following fields:
- ADB URL: Enter the ADB URL.
- OAuth Client ID: client_id you generate during authentication.
- OAuth Client Secret: client_secret you generate during authentication. Refer to the Create Connections with the Google spreadsheet section for more details.
Description of the illustration adb-google-wizard.png - Select Authorize.
After successful authorization of the credentials, you can now view Use a wizard…, Type a SQL… and Clear Data… menu items under Ask Oracle.
Query an Analytic View in Google Sheets
Selecting Use a Wizard.. opens an Oracle Autonomous Database wizard in the Google sheet.
The add-on enables you to receive a copy of data from the Autonomous Database to the Google sheet. You can query an existing Analytic View by using the Oracle Autonomous Database Wizard.
You can retrieve the Analytic View and manipulate the query according to your requirements to visualize the result data in the worksheet. You can search for the Analytic View, select measures, hierarchies, and levels from the query. You also have options to add filters and calculated measures to the query and view the query result in the sheet.
By default, the data is retrieved in tabular format. You also have the option to create pivot table from this data.
The Oracle Autonomous Database wizard that opens on selecting Use a Wizard.. has three panels:
- Analytic View panel: The Analytic View panel contains a list of Analytic Views from which you build queries. You edit the query by selecting measures, hierarchies and levels and progress to the next panel.
- Filter panel: The Filter panel displays to the right of the Analytic View panel. This panel allows you to add filter conditions to data, select which data to retrieve, and add calculations to the query.
- Query Result panel: The Query Result panel displays to the right of the Filter panel. Once you select the filter criteria and determine what calculated measures to add to your query, this panel automatically generates the query. You can view, revise and run the SQL query. After the SQL query runs, you view the query results in the worksheet. You can select the output format of the result here. You can view the results in tabular format or in the form of a pivot table.
To query an Analytic View and explore the Query Wizard menu in the Google Sheets:
- In the Google Sheet, select the menu item Ask Oracle > Use a Wizard…. Selecting Use a Wizard opens an Oracle Autonomous Database dialog box in the Google task pane.
- Select an existing Analytic View from the drop-down in the Analytic View pane. As you select the Analytic View, it appears on the Analytic View field.
- Select your choice of measures, hierarchies, and levels from list of available measures, hierarchies and levels associated with the Analytic View. Click Next.
- The wizard window progresses to the Filter pane where you can add or edit filters to a query.
- Under Add or Edit filter conditions, do the following:
- Select the column name and the attribute name from the drop-down. The values of the attribute change dynamically with the change in column names.
- Select an operator in the Operator field to apply to the values that you specify in the Value field.
- Specify a value or values from the list that contains members of the column that you select. You need to enter the value into the Values field manually. For example, you can select > in the Operator field to use only values greater than the value that you select in the Value list. If you select 100,000 from the Value list, then the filter uses values from the column that are greater than 100,000. You can use this information in an analysis to focus on products that are performing well.
- Click Add Filter to add another filter condition.
- Under Add or Edit Calculations, do the following.
- Specify the column whose values you want to include in the group or calculated item.
- In the Calc expression field, enter a custom calculated expression you want to perform on the column value. You can add functions or conditional expressions.
- Click Next to progress to the Query Result.
- You can view, edit, and review the query you have generated from the Query Review editor.
- Select Remove empty columns to remove empty columns from the result.
- Select Column per level to retrieve all levels of a hierarchy in a single column.
- Select the worksheet where you want to view the result from the drop-down.
- Click Submit to run the query.
- You can view the result of the query in the worksheet you select.
- You can modify the query in the Oracle Autonomous Database dialog box editor even after results are generated.
- Select Table under Display properties to view the results in the worksheet in a tabular format.
- Select Pivot under Display properties to view the results in the worksheet in Pivot format.
View the results in Pivot tables
Pivot table view is an interactive view that allows you to transpose rows and columns. A pivot table can summarize, sort, reorganize, count total and perform average of the result data.
To view the query results in pivot table mode, select the Pivot option under Display properties in the Autonomous Database wizard. Click Submit to view the query results in Pivot table.
Run SQL Queries
The Oracle Autonomous Database add-on for Google Sheets lets you run SQL queries to work with your data in a Google Sheet. With the add-on you can type your SQL code in the SQL editor area and click Run to run the command.
The add-on loads the result in the Google Sheet. The time taken to load the results depends on the number of records and the complexity of the query.
- In the Google Sheet, select the menu item Ask Oracle.
- Select Type a SQL… to type and run SQL command.
- The Oracle Autonomous Database wizard opens with a blank SQL editor where you can specify the SQL command to query data.
- Write the query in the SQL query editor.
- Click Run to run the query and display the results in the worksheet. You can click the + sign beside the Select worksheet drop-down to display the results in a new worksheet.
- The worksheet also displays information such as the timestamp and the user who creates and runs the query.
To run another query follow these steps:
- Clear the previous query from the SQL editor and write the new query.
- In the Select worksheet drop-down, select a new sheet, Sheet 2 in this case. The add-on adds a sheet for the user. If you choose to work on the same sheet, the add-on refreshes the data in the existing worksheet.
- Click Run to display the query results. Ensure that your sheet is not in edit mode, or else you will receive an error.
Clear query results
Once the add-on runs the query and retrieves the data into the worksheet, you can view the Timestamp, User, AV-query and SQL-query of the Analytic View in the automatically generated query results.
The worksheet displays the result of the query at one go. Consider, for example, if you want to modify the query and generate the query result in the same sheet. You must clear the existing data in the sheet.
To clear query results in the Google sheet, click the menu item Ask Oracle and select Clear data….
This option erases all types of data including images and formatting in the selected sheet.
Share or Publish
Once you generate the query results in the Google Sheet, you can share it with other users. With sharing, creates a copy of the worksheet and sends it with the design tools hidden and worksheet protection turned on.
- Review and inspect to remove personal or sensitive information.
- Save the source version of the worksheet. Consider adding a file name suffix of –src for the source worksheet. Then, remove the suffix in the distributed copy.
Once you are ready to distribute to the users, click Share.
- In the Share window that appears, add the user email IDs with whom you want to share the Sheets and to whom you want to provide permissions for accessing the Sheets.
- You can select the permission of the users from the drop-down. Select Editors if you want the user to share the worksheet. Viewers and commenters can see the option to download, print and copy but not share the sheets.
- Select Notify people check-box to notify the users of the share.
- Under General access, select Restricted from the drop-down to share it with people who have access to the link. You could also share it with people who do not have access by selecting Anyone with the link from the drop-down.