Create a Property Graph from an RDF Graph
Graph Studio provides a modeler interface where you can map from an existing RDF graph to a create a PGQL property graph.
- Navigate to the Graphs page using the Graphs menu link.
- Click the RDF Graph tab.The list of RDF graphs to which you have access are displayed as shown:
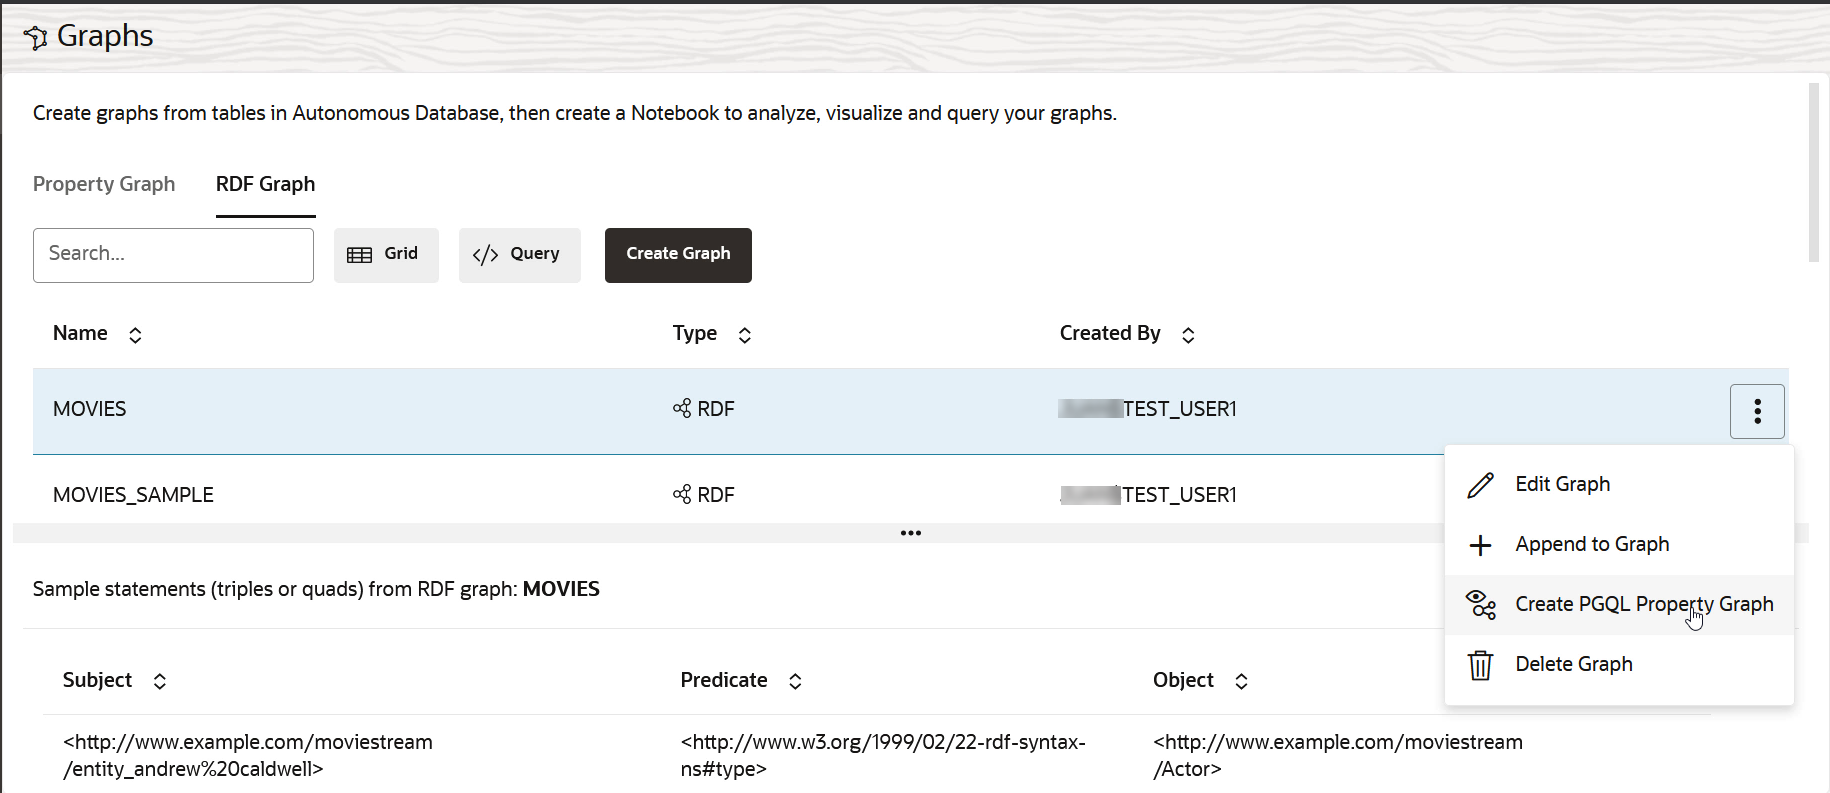
Description of the illustration create_pgql_pg_from_rdf_menu.png - Select the RDF graph from which you want to create a property graph and click open the additional options menu as shown in the preceding figure.
- Click Create PGQL Property Graph in the context
menu.The modeler interface opens and displays the Overview page as shown:
- Enter the Graph Name and click
Next.The Define Views page opens as shown:
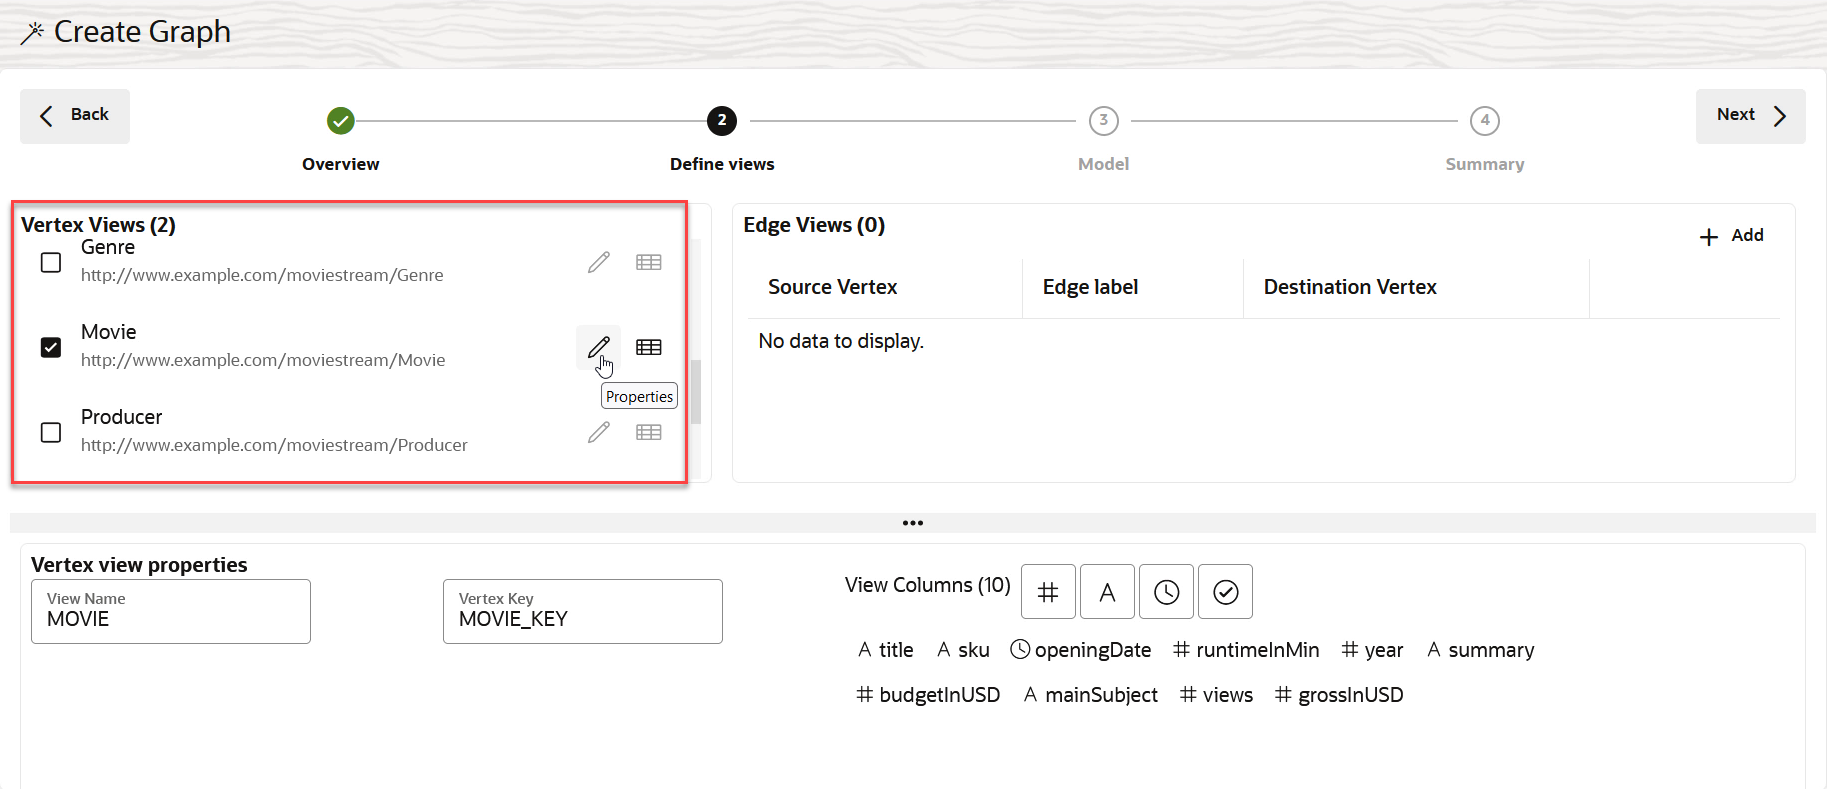
Description of the illustration rdf_pgql_pg_define_vertex_views.pngThis page displays the list of RDF classes for the graph in the top left Vertex Views pane. These RDF classes can be translated into vertices for the property graph. This step of the modeler interface also allows you to create the edges for the selected vertices in the top right Edge Views pane. For any selected vertex or edge view, you can view the corresponding Properties or Sample data details in the bottom pane of the page.
It is important to note that you must add atleast two vertex views and one edge view on this page.
- Select two or more RDF classes to define the required Vertex Views (as shown highlighted in the preceding figure) for the graph.
- Optionally, review the Properties or the
Sample data for any selected vertex view in the
bottom details pane.You can choose to perform any of the following actions, if required, when viewing the Vertex view properties:
- Change the View Name.
- Change the Vertex Key name.
- View columns by applying the following column filters:
- Filter by Number
- Filter by Text
- Filter by Time
- Filter by Boolean
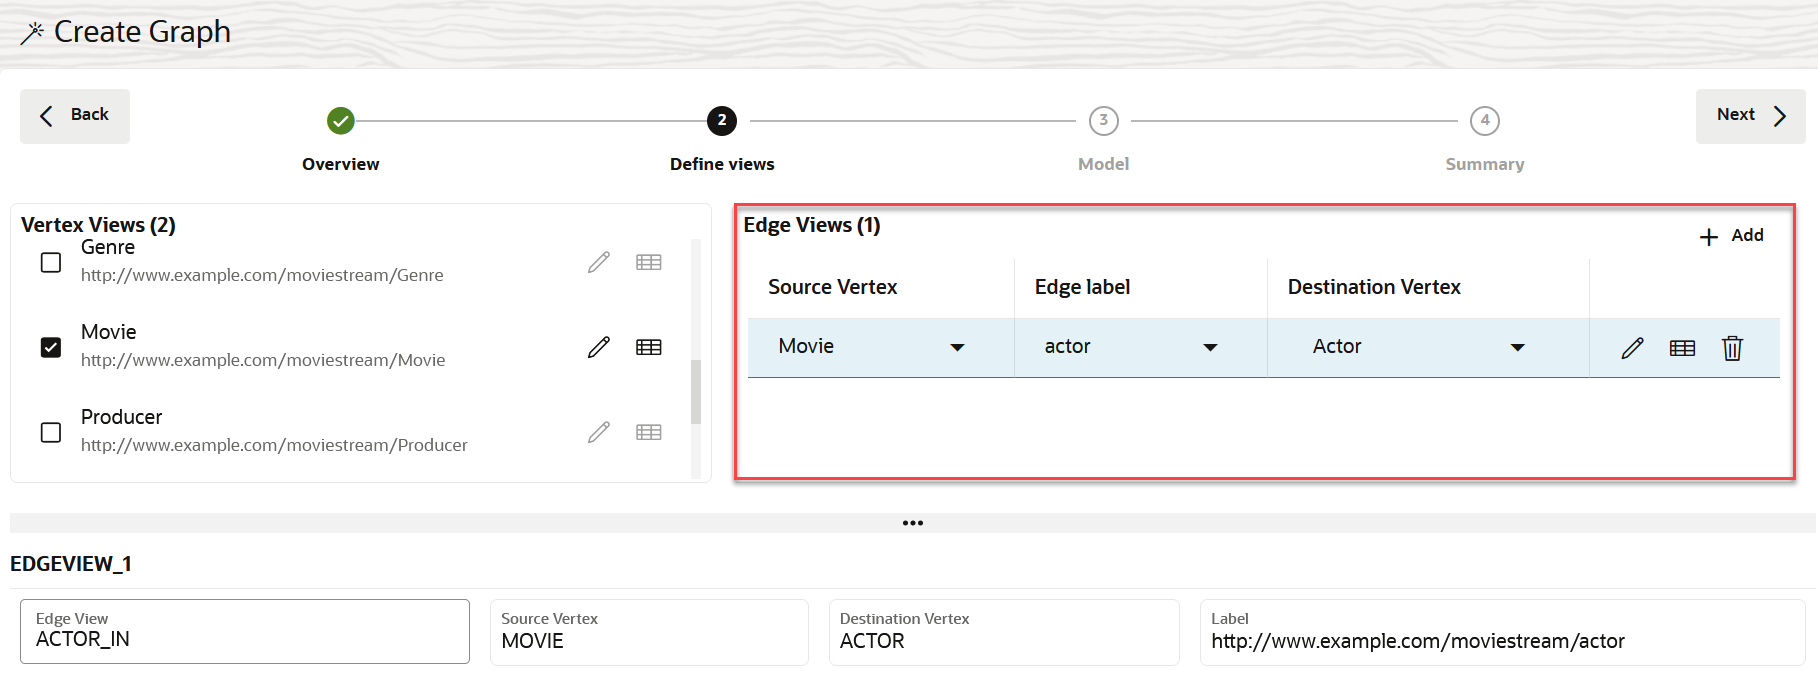
- Add one or more edge views by clicking Add in the top
right Edge Views section (shown highlighted in the figure
in the following step).A new row gets added to the panel where you can provide the source and destination vertices along with the edge label.
- Select a Source Vertex, Edge Label, and Destination Vertex.
- Optionally, choose to perform any of the following actions for any added edge
view.
 : Review the edge Properties and
optionally, change the Edge View name in the
bottom details section.
 : Review the Sample data.
 : Delete the edge view.
- Click Next to proceed.The Model page of the workflow opens as shown:
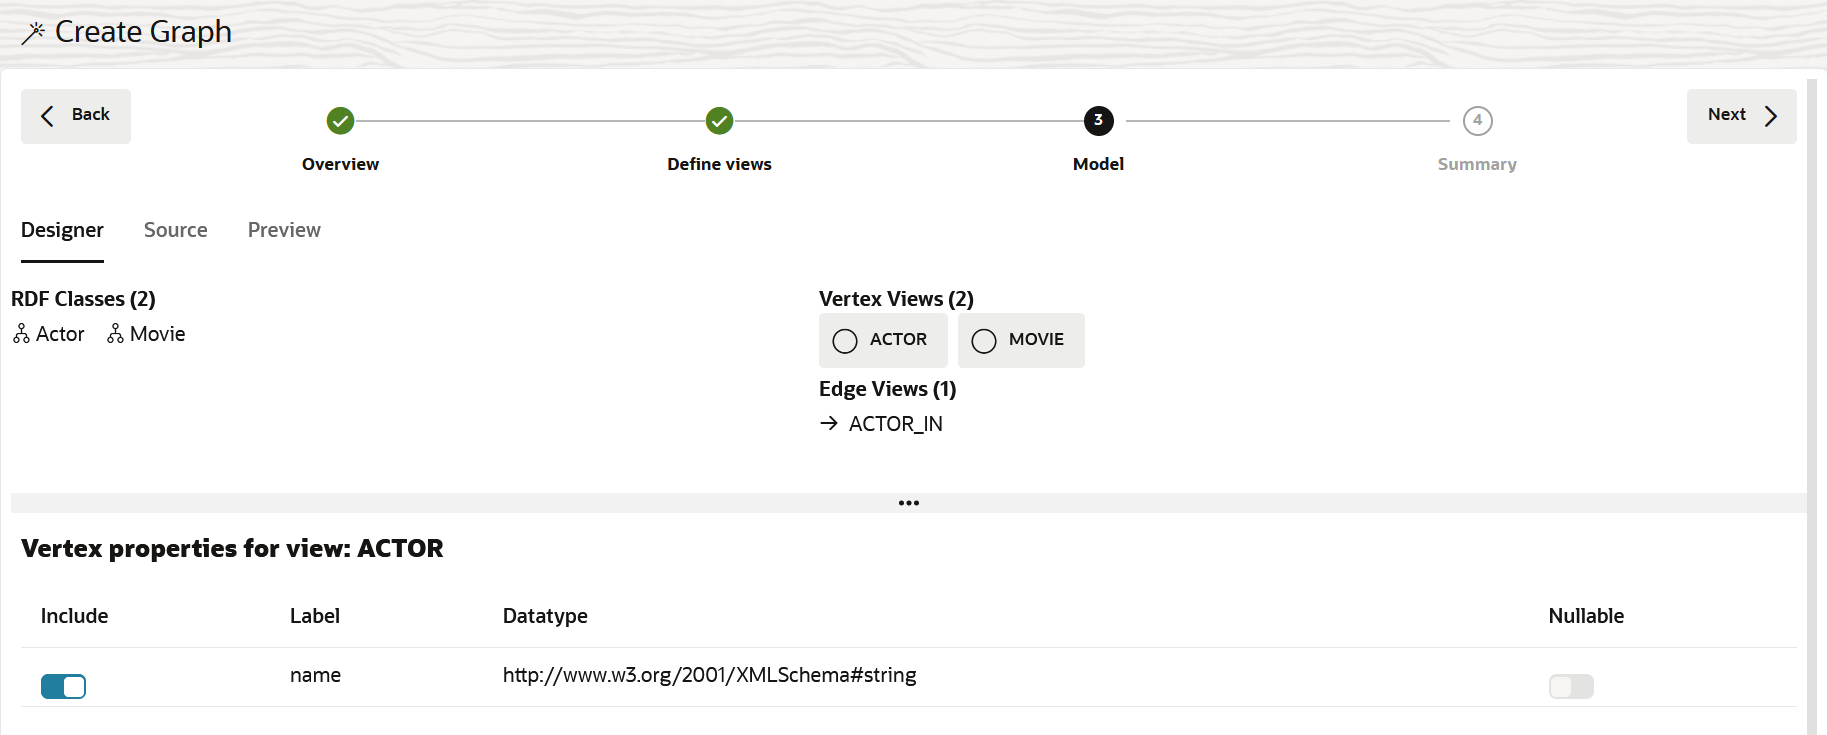
Description of the illustration rdf_pgql_pg_model.pngThis page comprises the following three tabs:
- Designer: To review the selected vertices and edges of the property graph. Also, you can determine the properties to be included for a vertex and configure the nullable constraint for a vertex property.
- Source: To view the
CREATE PROPERTY GRAPHsource statement for the graph. - Preview: To preview the modeled graph.
- Optionally, click any vertex view in the Designer tab
and choose to perform any of the following actions in the bottom
Vertex properties for view details pane.
- Include: Switch ON or OFF this toggle to indicate if a property is included or excluded. Note that atleast one property must be included for a vertex view. Otherwise, you cannot proceed to the next step of the workflow.
- Nullable: Switch ON or OFF this
toggle to indicate the nullable constraint for a property.
TRUE: Vertices withNULL(missing) values for the property will be included.FALSE: Vertices withNULL(missing) values for the property will be excluded.
Note that atleast one
FALSEproperty must be included.
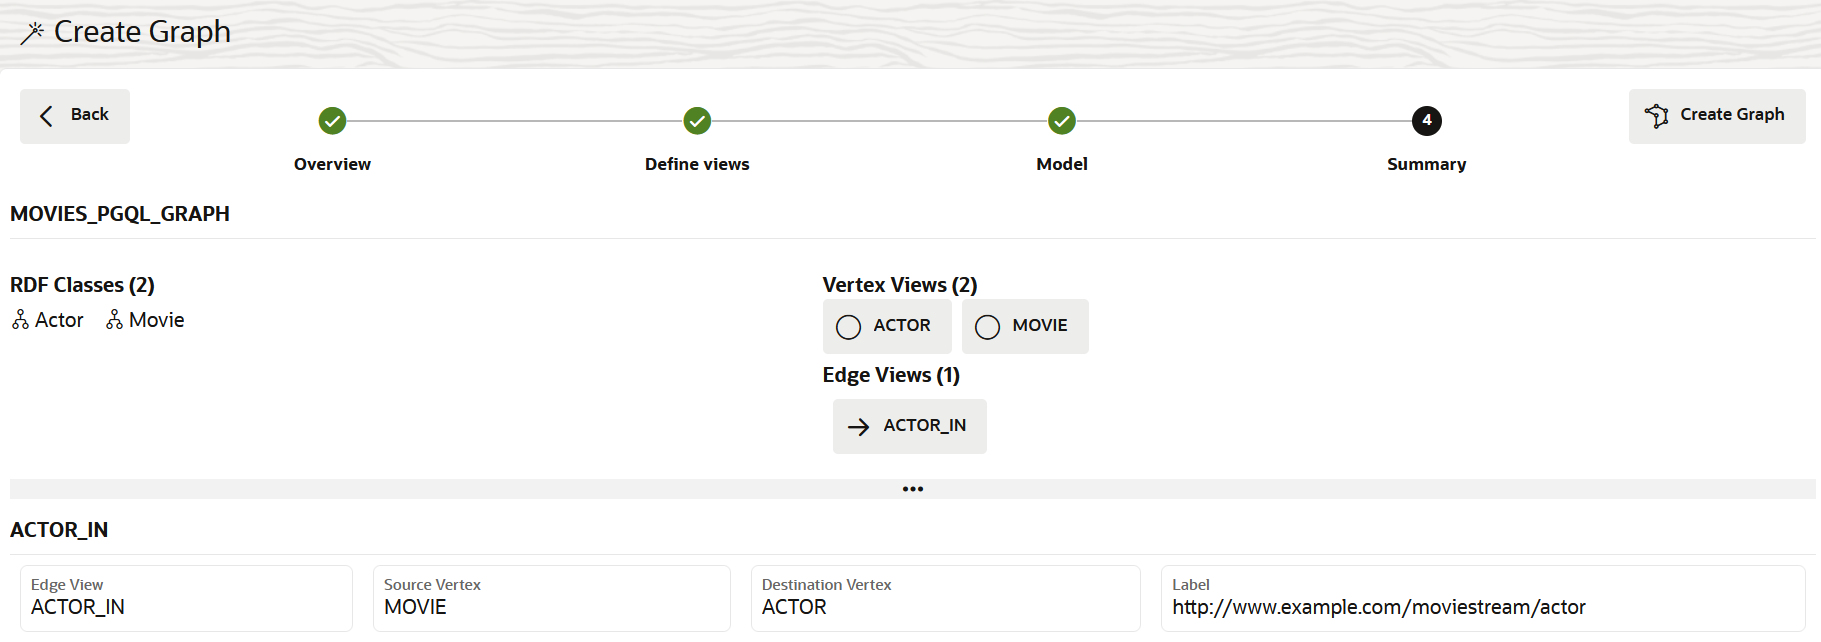
- Click Next to view the property graph Summary.
- Click Create Graph.The graph creation job is initiated on the Jobs page. Once the job completes successfully, you can view the newly created PGQL property graph on the Graphs page in the Property Graph tab.
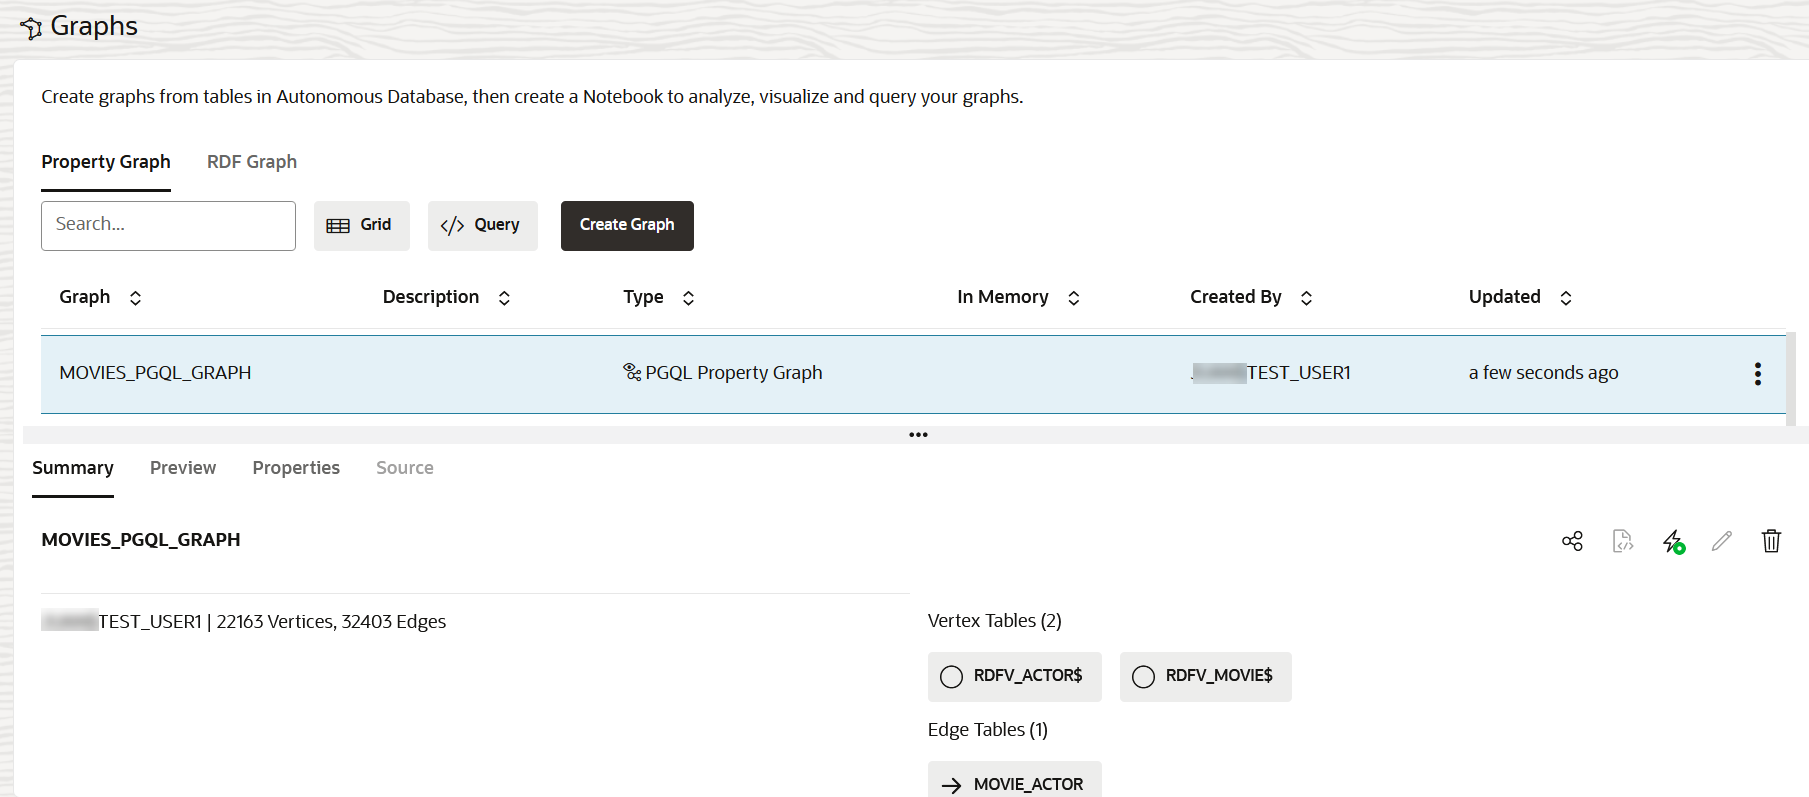
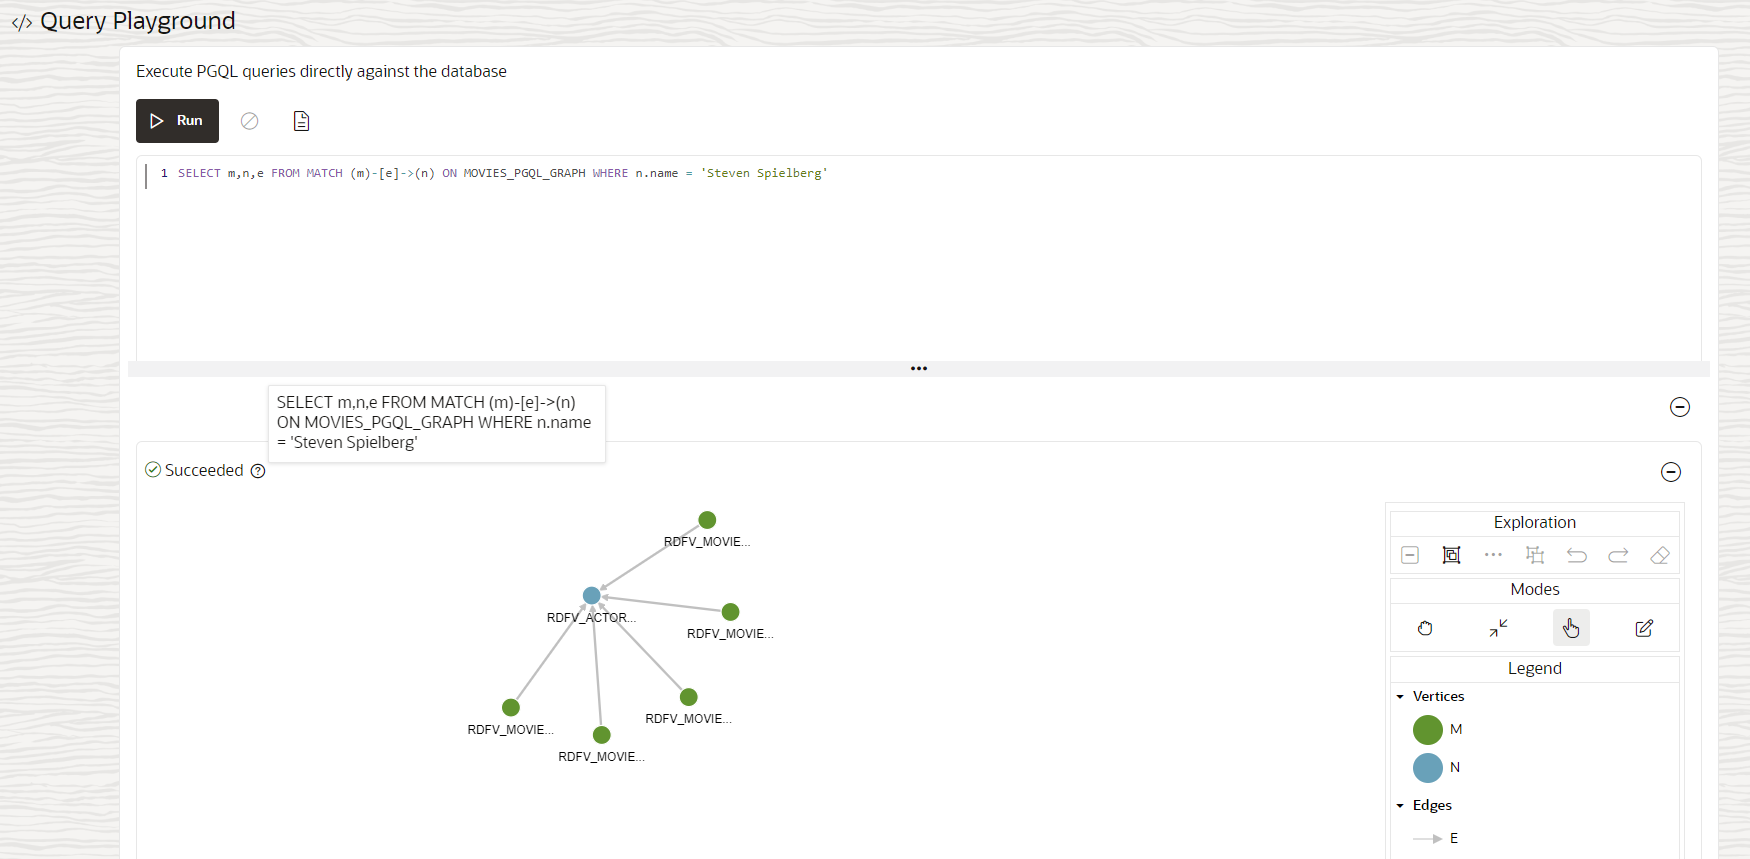
Description of the illustration pgql_pg_from_rdf.pngOnce the graph is created, you can run PGQL queries on the graph in the Query Playground page or analyze and visualize the graph using a Notebook.
The following figure shows an example PGQL query that is executed on the graph in the Query Playground page:
Description of the illustration rdf_pgql_query_playground.png

