- Using Graph Studio in Oracle Autonomous Database
- Interactive Graph Visualization in Oracle APEX Applications
- Get Started with the APEX Graph Visualization Plug-in
Get Started with the APEX Graph Visualization Plug-in
Get started with the APEX Graph Visualization plug-in in your APEX application on your Autonomous Database instance.
Before you begin, ensure that you meet the prerequisites described in
Prerequisites for Using the APEX Graph Visualization Plug-in.
- Download the Graph Visualization (Preview) plug-in from Oracle APEX GitHub repository.
- Sign in to your APEX workspace in your Autonomous Database instance.
- Import the downloaded plug-in script
(
region_type_plugin_graphviz.sql) file into your target APEX application by following the steps in Importing Plug-ins in the Oracle Application Express App Builder User’s Guide. - Implement the plug-in in an application page to perform graph
visualization.The following basic example describes the steps to visualize a graph existing in your Autonomous Database instance using the Graph Visualization plug-in.
- Open the application page in Page Designer.
- Select the Rendering tab on the left pane of the Page Designer.
- Right-click an existing component and add a new region component.
- Select the new region and configure the following attributes
in the Region tab of the Property
Editor on the right pane of the Page Designer:
- Enter the Identification Title.
- Select Graph Visualization (Preview) as Identification Type.
- Select the source Location as Local Database.
- Select Type as SQL Query.
- Run a SQL query, which wraps a PGQL query in the
ORA_PGQL_TO_JSONPL/SQL function, to retrieve the graph data.For example:
SELECT
  ORA_PGQL_TO_JSON(query => 'SELECT e FROM MATCH
    (e:employees) ON OEHR_EMPLOYESS LIMIT 20')
  FROM DUAL;
It is important to note the following:
- The plugin accepts the input graph data
containing the vertex and edge information in JSON
format only. This is supported by the
ORA_PGQL_TO_JSONPL/SQL function which takes a PGQL query as input and returns the graph output in JSON structure. - The graph referenced in the PGQL query must exist in your Autonomous Database instance.
- The plugin accepts the input graph data
containing the vertex and edge information in JSON
format only. This is supported by the
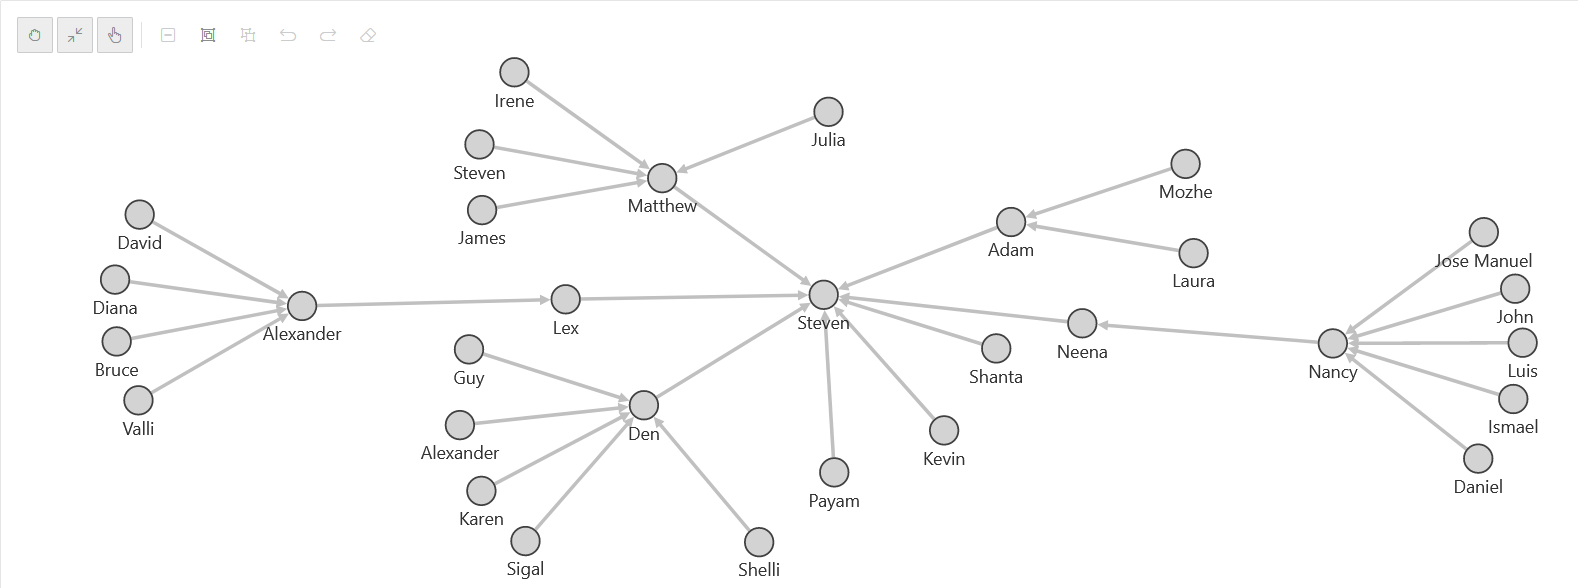
- Run the application page to visualize the graph rendered by
the plug-in.

Description of the illustration apex_basic_graph.png
- Optionally, if you wish to implement pagination in the preceding graph
visualization, then perform the following steps:
- Switch ON the SQL Query Supports Pagination setting in the Attributes tab of the Property Editor for the graph visualization component in your APEX application.
- Bind the
page_startandpage_sizeparameters when calling theORA_PGQL_TO_JSONfunction in the SQL query as shown in the following example code:SELECT ORA_PGQL_TO_JSON(query => 'SELECT e FROM MATCH (e:employees) ON OEHR_EMPLOYESS LIMIT 20',:page_start,:page_size) AS result FROM DUAL; - Set the Page Size value in the
Attributes tab of the Property Editor.Note that the page_start value is automatcially set.
- Save and rerun the application page.The graph gets rendered with pagination.
- Optionally, download the Sample Graph Visualizations application from
Oracle APEX GitHub
repository.This application demonstrates the use of the Graph Visualization plug-in.
- Import the downloaded
sample-apps/sample-graph-visualizations/sample-graph-visualizations_19adb.sqlinto your APEX instance by following the steps in Importing an Application. - Run the sample application from the application home page in App Builder.
- Import the downloaded