Manage Property Graphs
You can select an individual graph to view its details and perform actions such as refreshing metadata, viewing warnings, renaming, editing, sharing or querying the graph. You can also select one or more graphs to load, unload, or delete them.
To manage property graphs:
-
Click Graphs on the main navigation menu and navigate to the Graphs page.
-
Select the Property Graph tab to view the list of property graphs for which you have access in the Autonomous AI Database.
The type of property graph displayed by default on the Graphs page is determined by the drop-down value shown highlighted in the following figure:
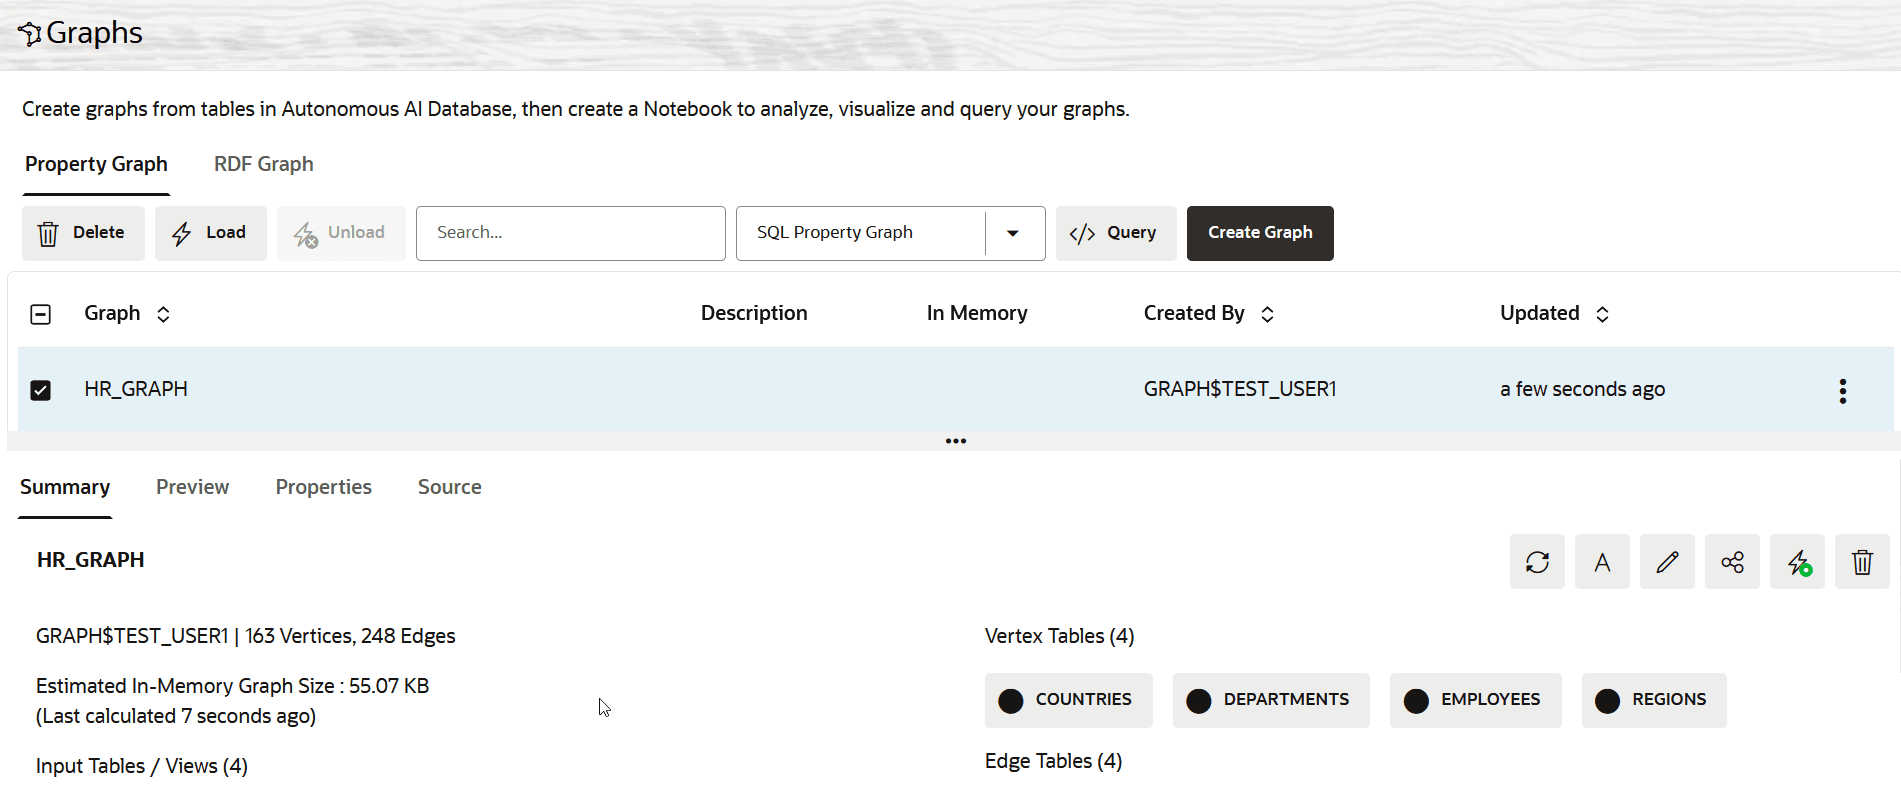
Description of the illustration manage_property_graphs.png
The drop-down supports one or both of the following values depending on the database version used in your Autonomous AI Database instance:
-
SQL Property Graph: This is the default property graph type displayed on the Graphs page if you are using Oracle AI Database 26ai.
-
PGQL Property Graph: The PGQL property graph type is available on all types of tenancies and supported on all database versions. This is the only supported type if you are using Oracle Database 19c.
Also, note the following:
-
When you select a property graph on the Graphs page, Graph Studio validates the graph and displays a
 (warning) symbol next to the graph if it has any issues. You can click Show Warnings in the graph details panel to know more about the warnings.
 -
The In Memory column indicates the property graphs that are loaded into memory. You must ensure to load a full graph or selected properties into memory before accessing it, as the notebook interpreters operate only on the in-memory graphs. See Available Notebook Interpreters for more information on notebook interpreters.
-
-
Choose one of the following actions.
-
Perform bulk actions on property graphs:
You can select the check boxes for one or more property graphs in the list and perform any one of the bulk actions displayed in the toolbar:
-
Load: Loads the selected graphs into memory.
-
Unload: Removes the selected graphs from memory.
-
Delete: Deletes the selected graphs.
The availability of an action depends on the state of the selected graphs. For example, Unload is available only for graphs that are loaded into memory.
-
-
View details and perform actions for a specific property graph:
-
Select any property graph.
The details of the graph are displayed in the graph details section of the Graphs page.
Note that this section also displays the previously computed Estimated In-Memory Graph Size.
-
Optionally, click to perform any one of the following actions on the property graph:
-
 : View and optionally resolve graph warnings.
Note: The Show Warnings action is displayed only for graphs that have warnings after validation.
For instance, the following shows a sample graph warning:
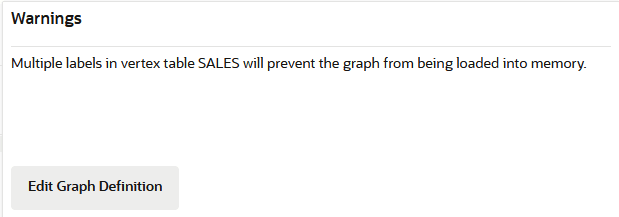
Description of the illustration sample_warning.png
You can click Edit Graph Definition if you wish to fix the warning or make any other changes to the graph definition.
-
 : Recompute the graph metadata to refresh metadata information about the graph which might have become stale, like the total number of vertices and edges. This action also recomputes and updates the Estimated In-Memory Graph Size.
 -
 : Change the graph name.
 -
 : Modify the graph definition.
 -
 : Share the graph with other users.
 -
 : Load the complete graph or selected properties into memory for analysis.
Note: Optionally, you can load a property graph by name directly in the notebook. See Load Graphs into Memory Programmatically for an example.
When you click the Load Graph Into Memory icon, the Load Graph into memory slider is displayed:
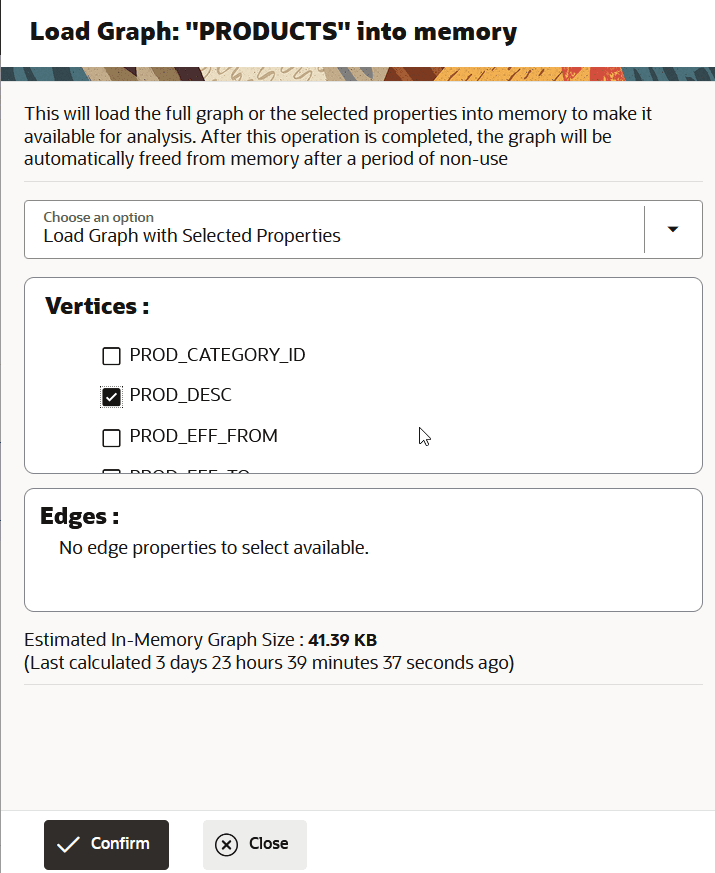
Description of the illustration load_graph_into_memory.png
You can choose one of the following options:
-
Load Graph with All Properties: In this case, the complete graph with all its properties will be loaded into memory.
-
Load Graph with Selected Properties: The slider will display the list of available vertex and edge properties for the graph. By default, all the properties are selected. You can choose to select (or deselect) specific vertex or edge properties that you wish to load into memory. Note that the properties that are unsupported by the graph server (PGX) will appear disabled.
-
-
 : Delete the graph.
 -
 : Convert a PGQL property graph to an SQL property graph.
Note that this option is supported only if you are using an Autonomous AI Database instance with Oracle AI Database 26ai. Also, this action is available only for PGQL property graphs. See Convert a PGQL Property Graph to SQL Property Graph for more information.
-
-
-
-
Optionally, click the </> Query button if you wish to query and validate the selected property graph in the Query Playground page.
Note: The </> Query Playground page for property graphs will be desupported in a future Graph Studio release. It is recommended that you use Graph Explorer for querying and visualizing property graphs.
The following example shows running SQL graph queries on a SQL property graph in the SQL tab of the Query Playground page. Note that the SQL tab is displayed only for Autonomous AI Database based on Oracle AI Database 26ai.
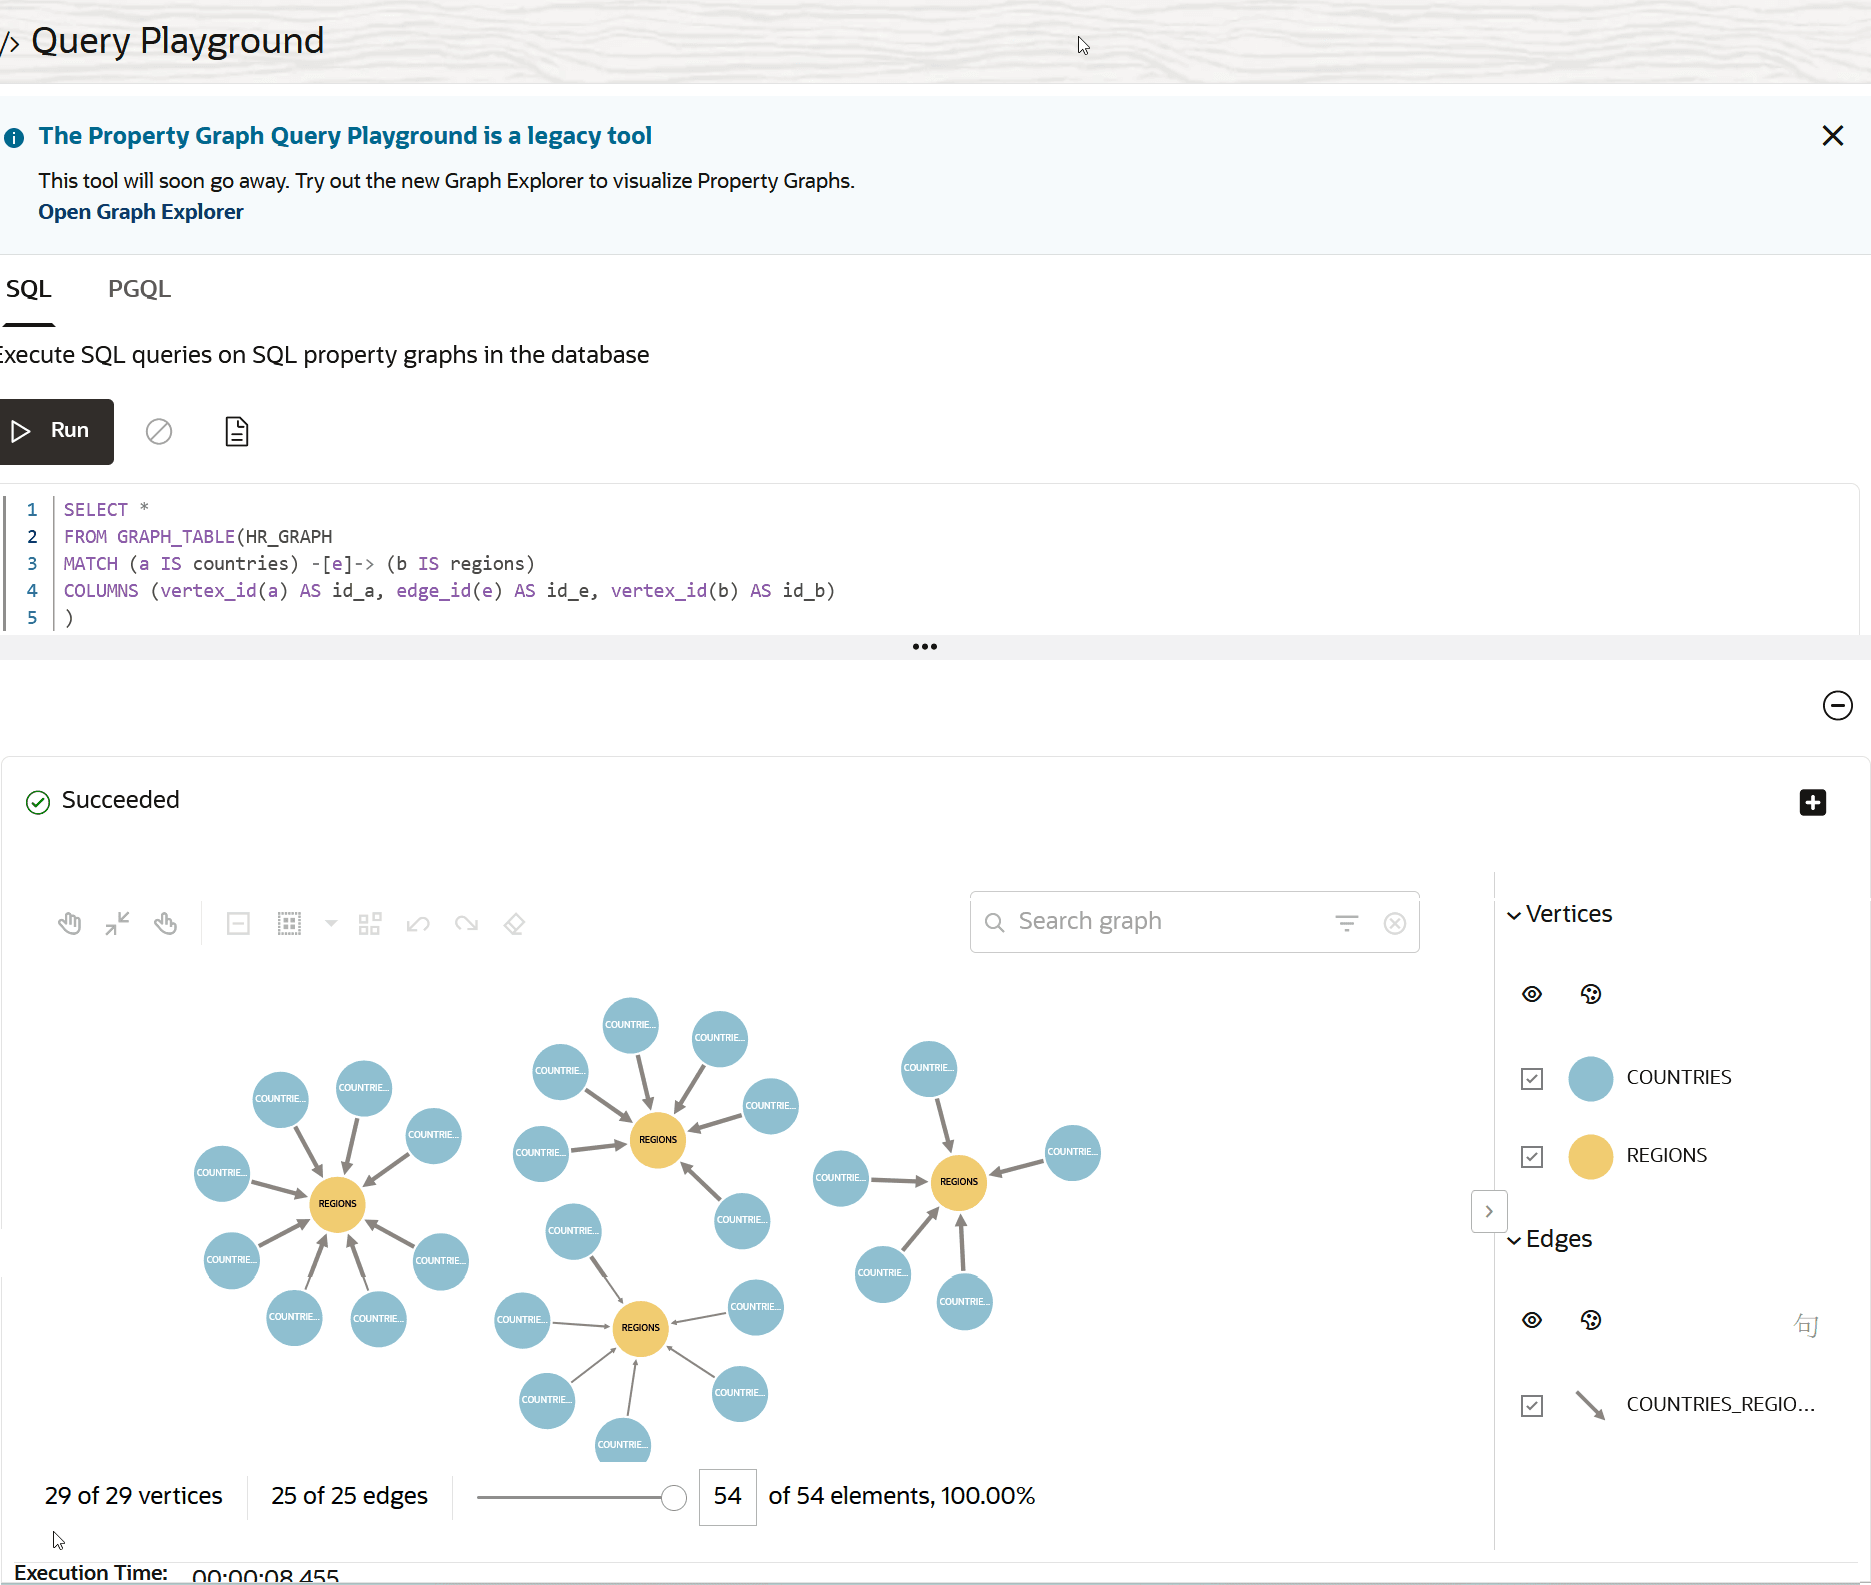
Description of the illustration sql_pg_qp_page.png
The following example shows running PGQL graph queries on a PGQL property graph in the PGQL tab of the Query Playground page:
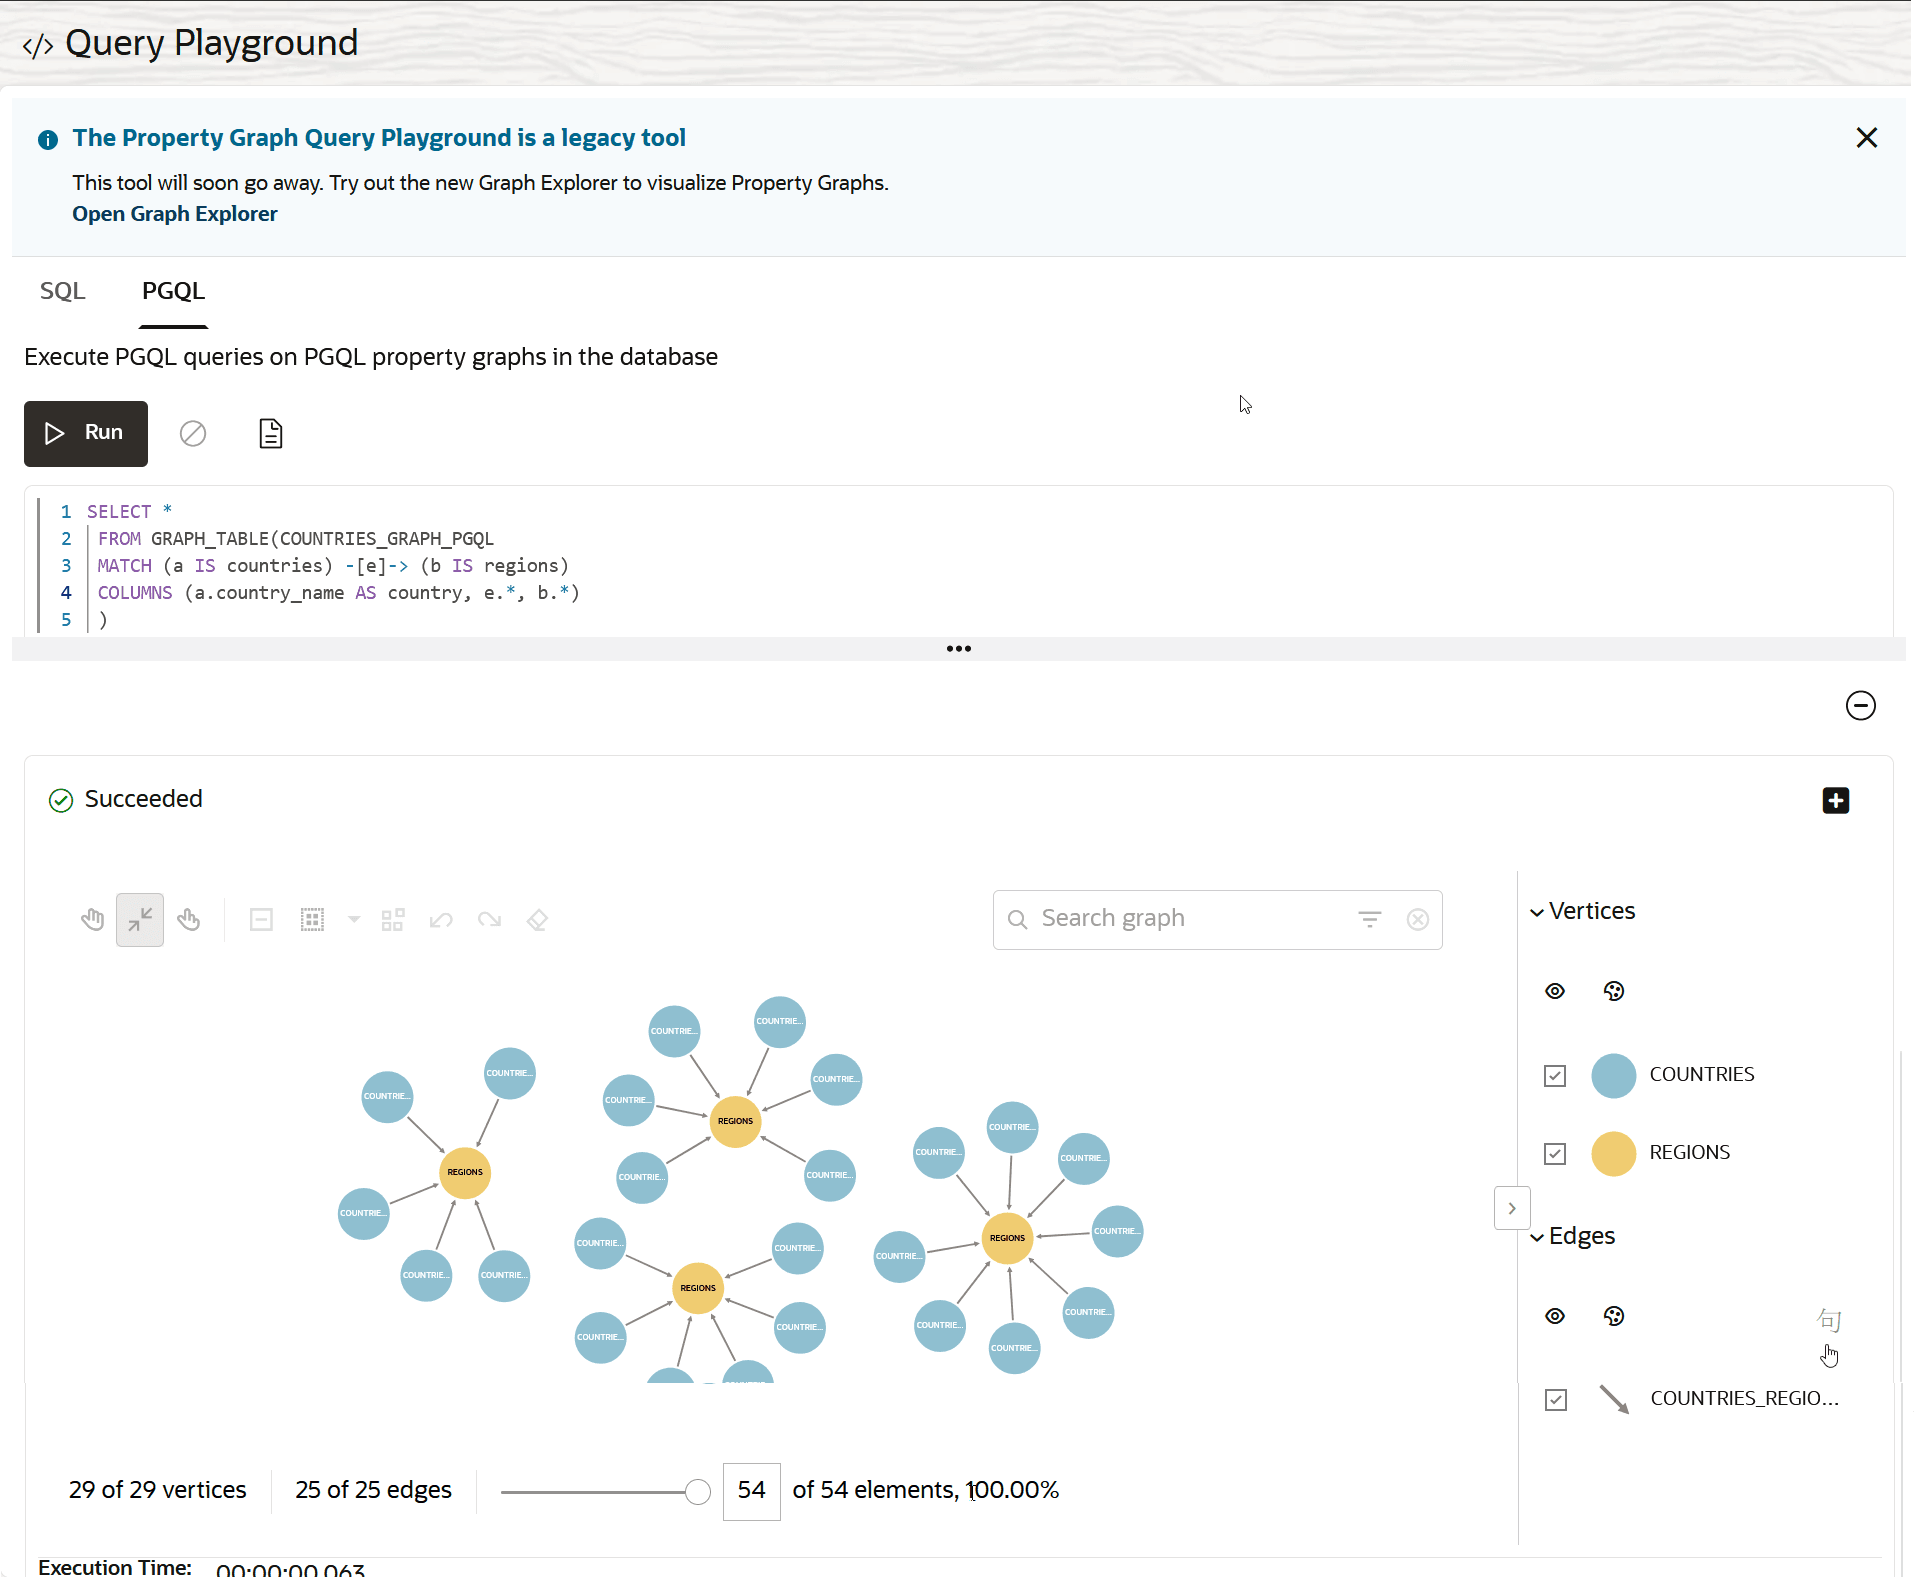
Description of the illustration query_playground.png
Also, note the following when using the Query Playground page:
-
CREATE PROPERTY GRAPHandDROP PROPERTY GRAPHstatements are supported. -
SELECTqueries are supported, and theSELECTquery results can be visualized, if applicable. -
To configure vertex or edge captions in the graph visualization, click Add Vertex or Edge Captions on the right side of the visualization panel.
Note: If a vertex label has a property named
captionortitle, then the value of that property is automatically used as the caption text to be displayed for that vertex in your graph visualization.The Captions slider opens as shown:
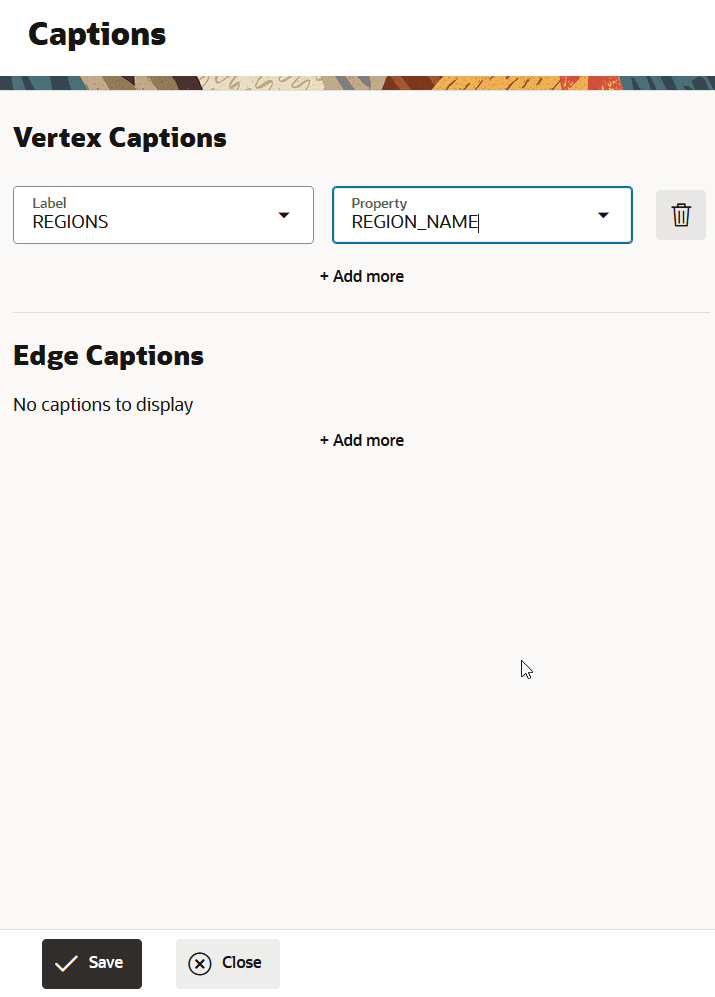
Description of the illustration captions_slider.png
-
Click + Add more in the Vertex Captions section or the Edge Captions section.
-
Select the Label and the corresponding Property.
-
Click Save to configure the captions.
-
-
INSERTandUPDATEqueries are not supported. -
All queries are executed as the currently logged in user.
-
The current query will be persisted in the browser’s local storage once executed.
-
You cannot run multiple statements or queries separated by semi-colon in the SQL tab. Only one SQL statement or query is allowed.
-