Creating Analytic Views
You can create Analytic Views and view information about them. You can also edit and perform other actions on them.
Description of the illustration adp-create-analytic-view.png
When you create an Analytic View, you identify a fact table that contains the data to inspect. The Generate Hierarchies and Measures button looks at the contents of that table, identifies any hierarchies in the fact table, and searches for other tables that may contain related hierarchies.
While creating an Analytic View, you can enable or disable the following advanced options:
-
Autonomous Aggregate Cache, which uses the dimensional metadata of the Analytic View to manage a cache and that improves query response time.
-
Analytic View Transparency Views, which presents Analytic Views as regular database views and enables you to use your analytic tools of choice while gaining the benefits of Analytic Views.
-
Analytic View Base Table Query Transformation, which enables you to use your existing reports and tools without requiring changes to them.
Create Analytic View
To create Analytic View, click Create from the Data Analysis home page and select Create Analytic View to begin the process.
Click Cancel to cancel the creation of the Analytic View at any time.
Specify Attributes of the Analytic View
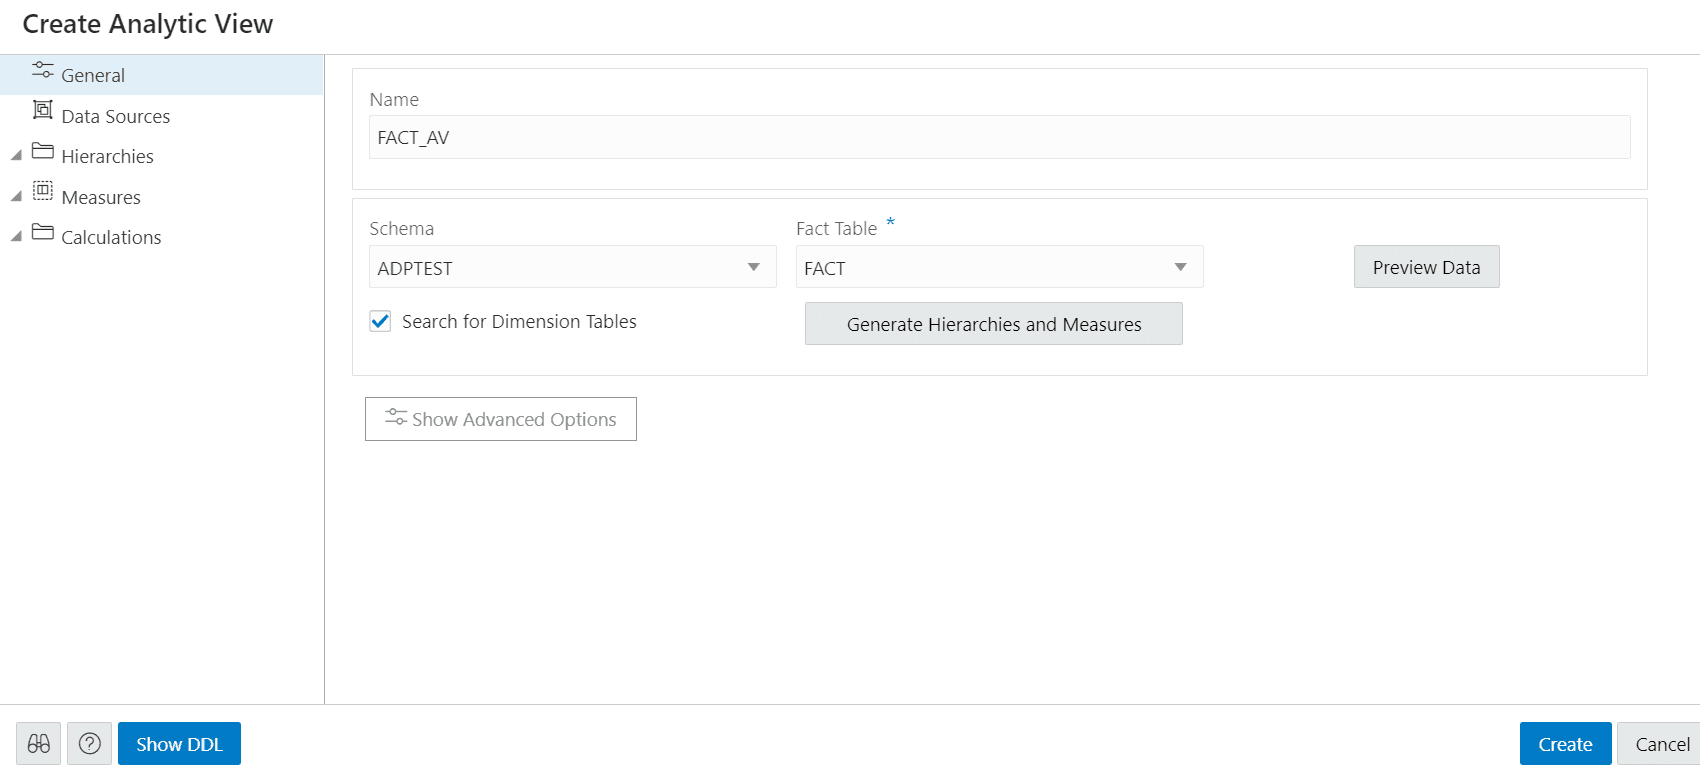
On the General tab of the Create Analytic View pane, specify the following:
-
The name for the Analytic View
-
The fact table for the view
-
Advanced options
You can also preview the data of the fact table and see statistics about that data.
In the Name field, specify a name of your choice.
The Schema field has the current user’s schema. You can only create an Analytic View in that schema.
In the Fact Table field, expand the drop-down list and click More Sources. The Select Sources dialog box has a list of the available tables and views. Select a table or view from the list.
To filter the list, begin typing characters in the Filter field. As you type, the list changes to show the tables or views that contain the characters. Clear the field to show the complete list again. After you select a table or view, click OK.
To enable or disable the advanced options, on the Create Analytic View pane, click the Show Advanced Options icon at the bottom left. Select or deselect options as desired.
To view the data in the fact table and statistics about the data, click the Preview Data button. In the Preview and Statistics pane, the Preview tab shows the columns of the table and the data in the columns.
The Statistics tab shows the size of the table and the number of rows and columns. The statistics may take a few moments to appear, during which time the message, “No statistics available…” may appear. The statistics include the names of the columns, their data types, the number of distinct values and null values, the maximum and minimum values, and other information. The bar graph displays the top unique column values and the number of their occurrences for the selected column. Point to a bar in the graph to see the number of occurrences of the unique value.
Click Close to close the Preview and Statistics pane and return to the Create Analytic View pane.
Click on Generate Hierarchies and Measures icon.
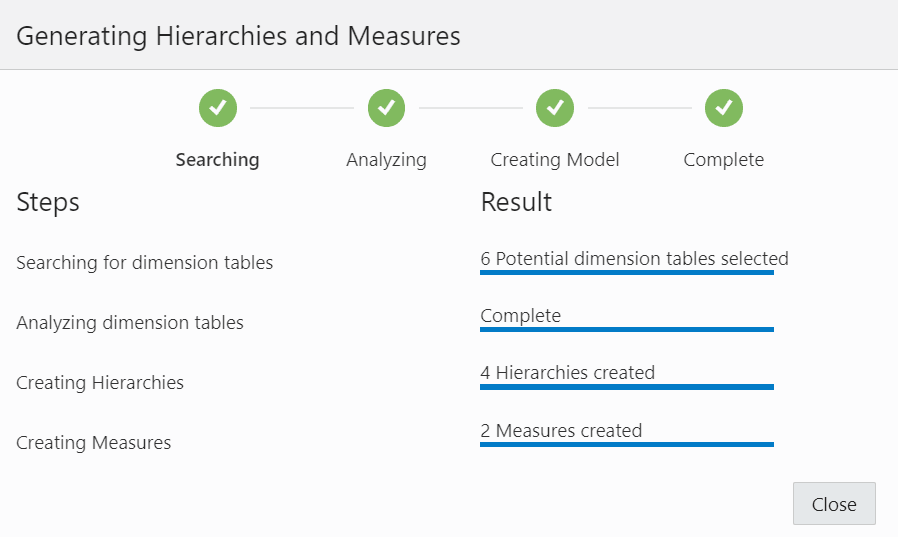
The Generating Hierarchies and Measures dialog box displays the progress of searching for dimension tables, analyzing the dimension tables and identifying and creating the data sources, joins, hierarchies, and measures to use. When the process completes, click Close.
Description of the illustration adp-generating-hierarchies-measures.png
The Search for Dimension Tables check box when selected, enables you to search for dimension tables while generating hierarchies and measures.
After the hierarchies and measures are generated, they are displayed under their respective tabs. Review the hierarchies and measures created for you.
Specify the Name, Fact Table and select Advanced Options in the General tab of Create Analytic View pane. Click Create to generate an Analytic View.
View Data Sources
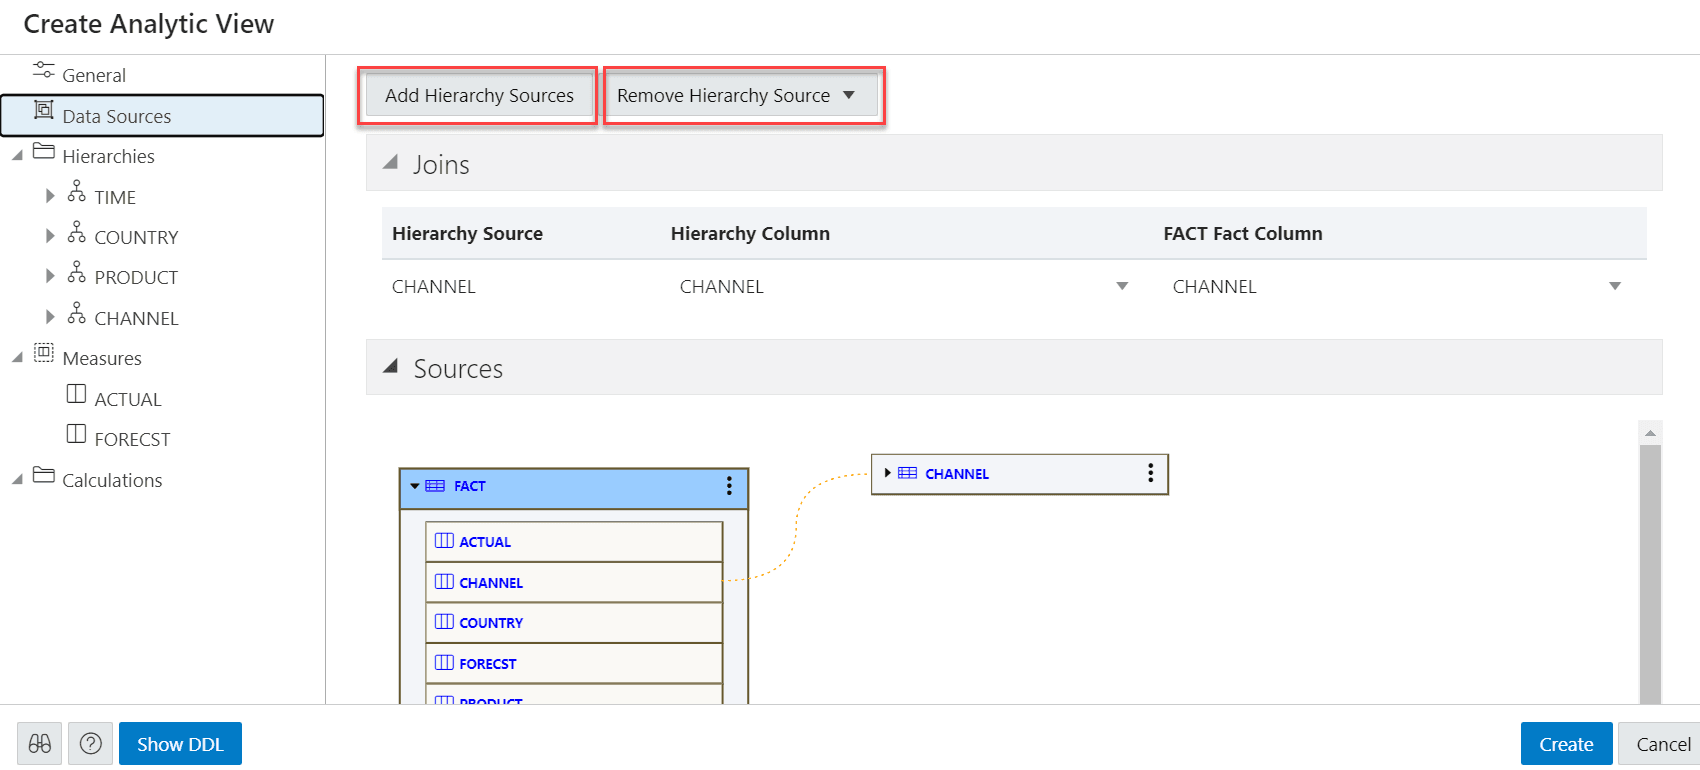
The Data Sources tab displays the sources of the data and the relationships among them. It has a graphical display of the fact table and the related dimension tables. For example, a fact table of health insurance data might have columns for geography identifiers, income codes, and gender codes. The Data Sources tab would display items for the fact table and for the geography, income, and gender dimension tables.
You can add hierarchies from data sources even after generating hierarchies from the existing fact table. You can add one or more hierarchies to your new or existing analytic view. Multiple hierarchies can be defined and used in an analytical view, however only one will be used by default.
Right-click the Data Sources tab and select Add Hierarchy Sources or select Add Hierarchy Sources.
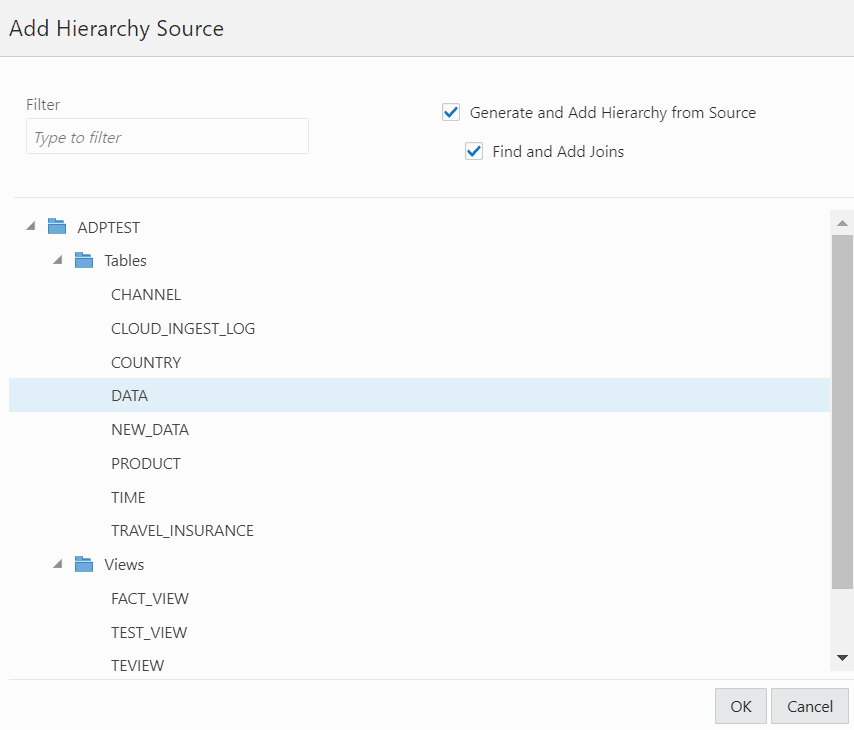
Selecting Add Hierarchy Sources launches an Add Hierarchy Source dialog box.
Description of the illustration add-hierarchy-source-wizard.png
You can view all the fact tables and views associated with the analytic view.
In the filter field, you can either manually look for the source or start typing to search for the fact table or views from the list of available fact tables and views. After typing the full name of the source, the tool automatically matches the fact table or view.
Select Generate and Add hierarchy from Source to generate analysis and hierarchies associated with the source data you select.
Select Find and Add Joins to link all the data sources with the fact table. You can add multiple join entries for a single hierarchy.
Click OK to select the source.
The Generating Hierarchies and Measures dialog box displays the progress of analyzing the dimension tables and creating the hierarchies. When the process completes, click Close.
Note: When you add a hierarchy from the data source, you see the new hierarchy in the list of hierarchies in the Hierarchies tab. You can navigate between the Data Sources tab, the Hierarchies tab, the Measures tab, the Calculations tab. You can add a hierarchy from a source that is not connected by navigating back to the Data Sources tab.
Select Remove Hierarchy Source to remove the hierarchies you create from the data sources. You cannot remove hierarchies generated from the fact table you select from this option.
Description of the illustration adp-view-data-sources.png
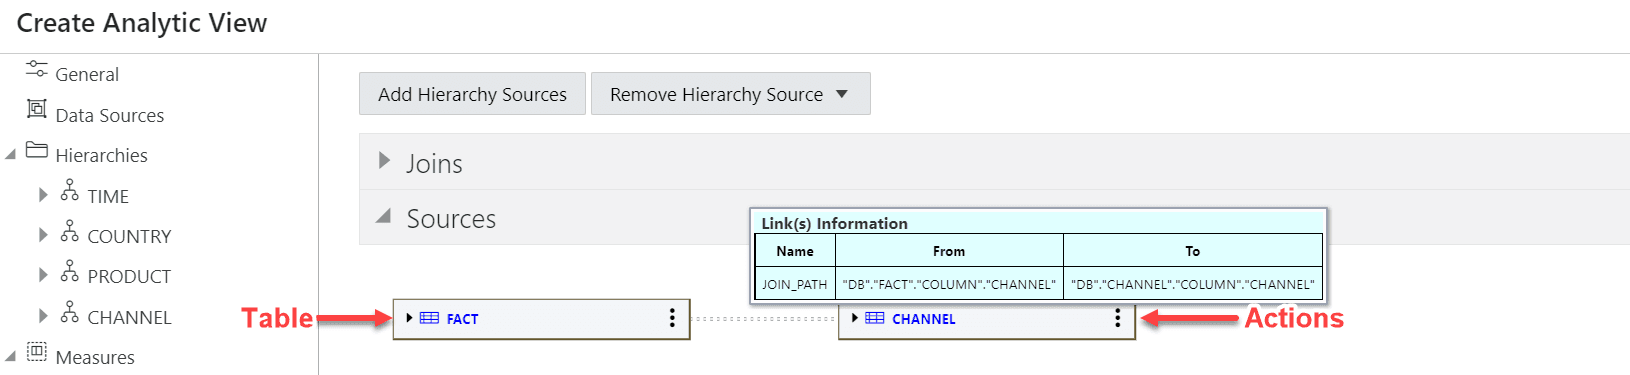
Expand Joins to view the Hierarchy Source, Hierarchy Column and the Fact column mapped with the Analytic View. The Joins is visible only when the hierarchy table differs from the fact table. You can add multiple join entries for a single hierarchy.
Expand Sources to view the fact table associated with the Analytic View. The data model expands to include the data from the source that you added.
Pointing to an item displays the name, application, type, path and the schema of the table. Click the Actions (three vertical dots) icon at the right of the item to display a menu to expand or collapse the view of the table.
Description of the illustration adp-table-data-sources.png
An expanded item displays the columns of the table. Pointing to a column displays the name, application, type, path, and schema of the column.
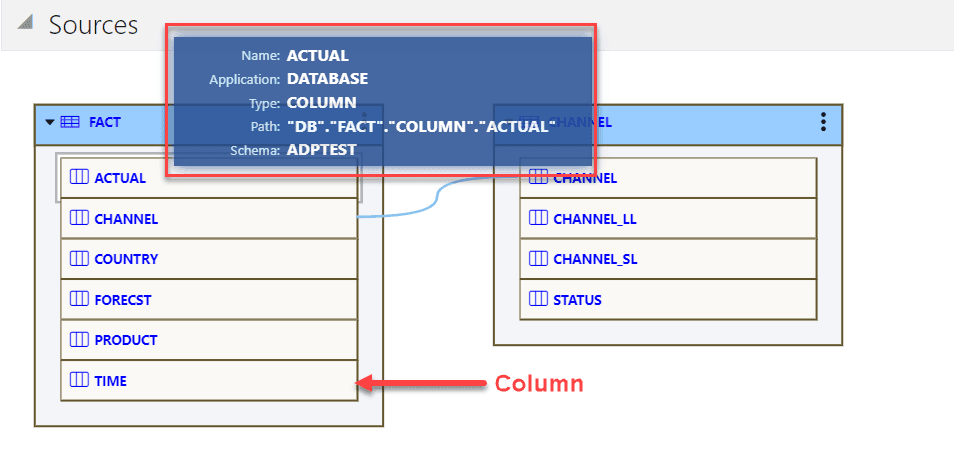
Description of the illustration adp-column-data-sources.png
The lines that connect the dimension tables to the fact table indicate the join paths between them. Pointing to a line displays information about the join paths of the links between the tables. If the line connects a table that is collapsed, then the line is dotted. If the line connects two expanded tables, then the line is solid and connects the column in the dimension table to the column in the fact table.
View and Manage Hierarchies
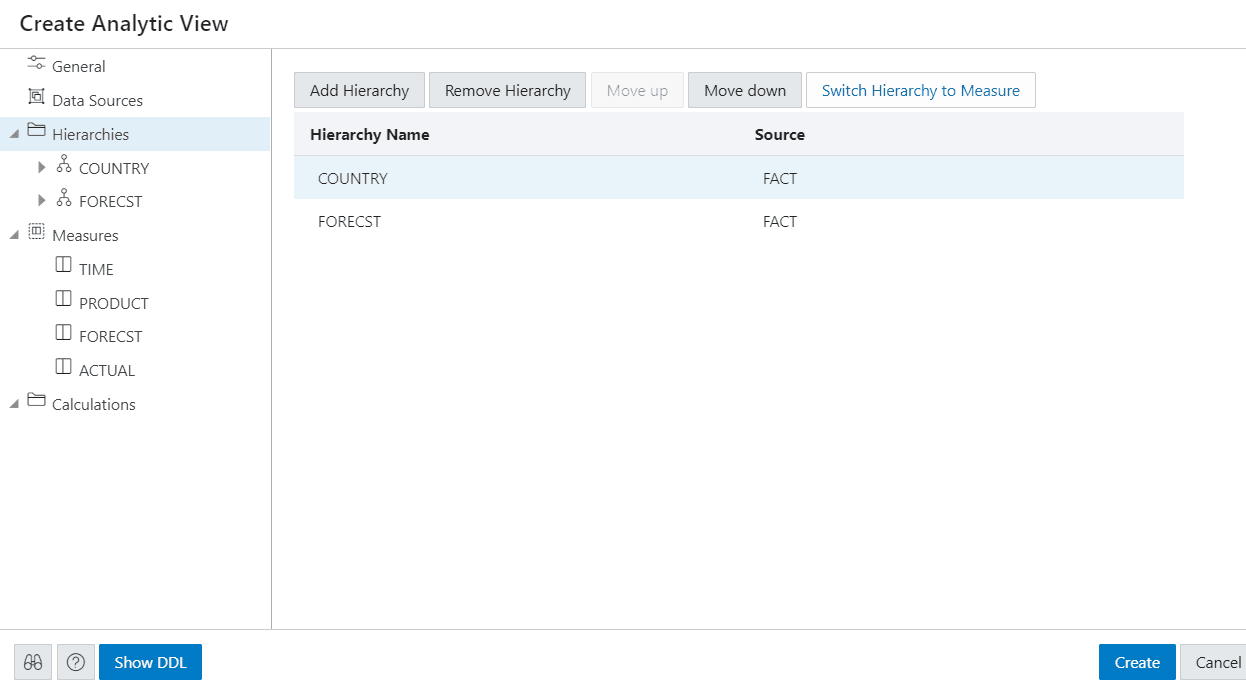
The Hierarchies tab displays the hierarchies generated by the Analytic View creation tool. The display includes the name of the hierarchy and the source table.
Description of the illustration hierarchies-tab.png
An analytic view must include at least one hierarchy.
To add a Hierarchy, click Add Hierarchy. This results in a display as a list of column in that table. Select a column that operates as the detailed level of the hierarchy and be the join-key to the fact table.
Description of the illustration add-hierarchy-fact-table.png
To remove the hierarchy, select the hierarchy you want to remove from the list and click Remove Hierarchy
Select Move Up or Move Down to position the order of the Hierarchy in the resulting view.
Click Switch Hierarchy to Measure to change the hierarchy you select to a measure in the Measures list.
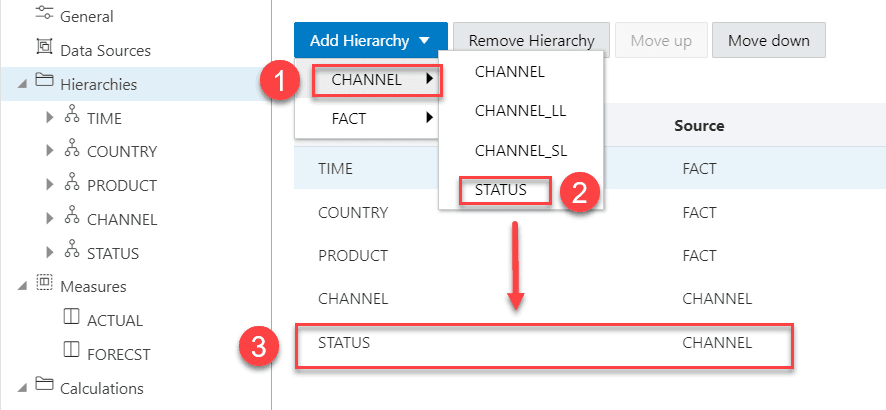
You can also Add Hierarchy and Add Hierarchy From Table by right-clicking the Hierarchy tab.
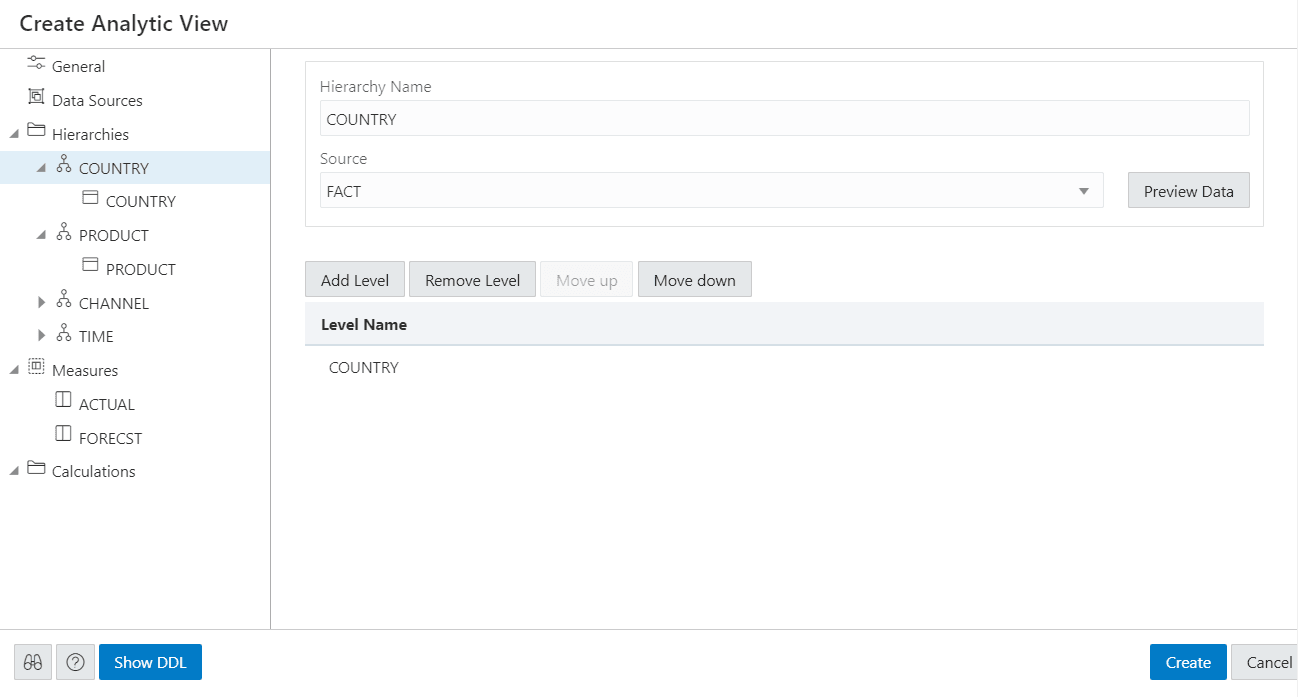
If you click on a hierarchy name, a dialog box displays the Hierarchy Name and Source.
To change the source, select a different source from the drop-down list.
Select Add Level to add a level to the hierarchy. Click Remove Level to remove the selected level from the hierarchy.
Description of the illustration hierarchy-new-view.png
To view the data in the fact table and statistics about the data, click the Preview Data button. In the Preview and Statistics pane, the Preview tab shows the columns of the table and the data in the columns. The Statistics tab shows the size of the table and the number of rows and columns.
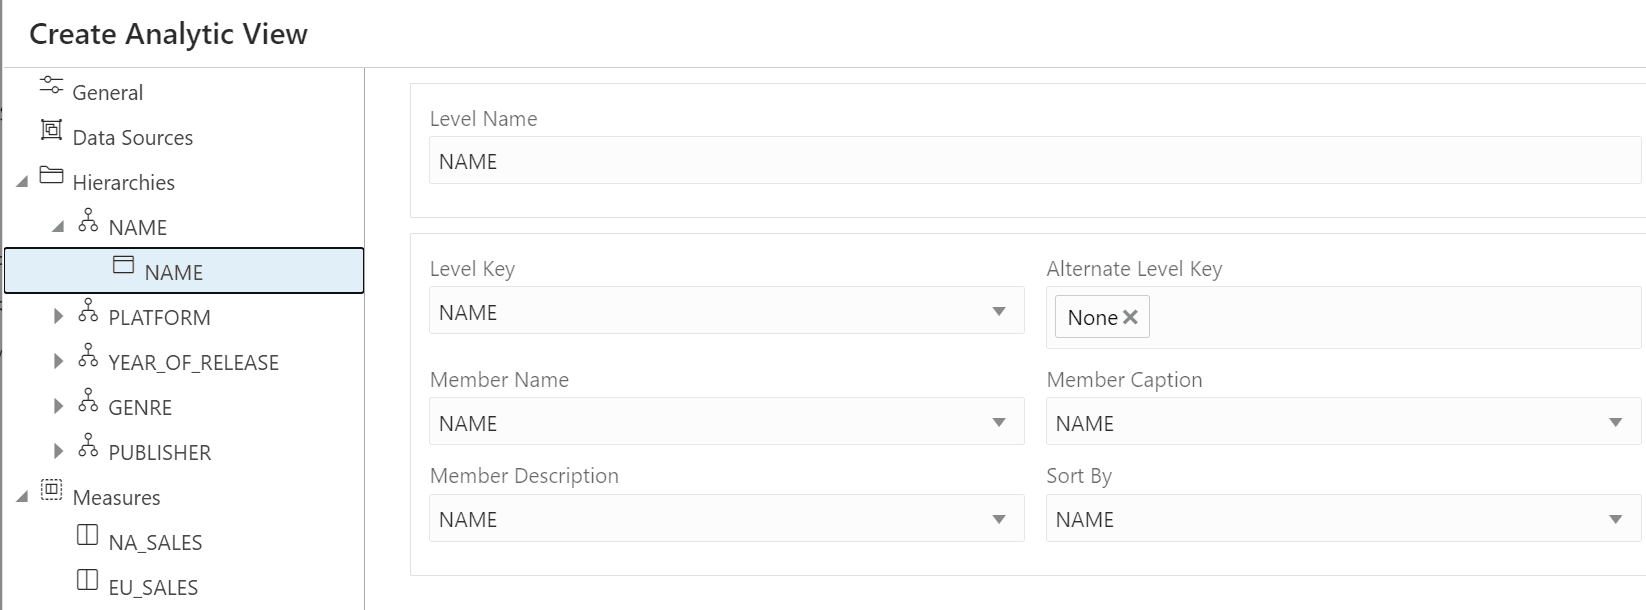
If you click on a particular level in the Hierarchy tab, a dialog box displays it’s respective Level Name, Level Key, Alternate Level Key, Member Name, Member Caption, Member Description, source, and Sort By drop-down. To change any of the field values, enter the value in the appropriate field.
Note: You can enter multiple level keys Member Name, Member Caption, Member Description and Sort By.
Description of the illustration hierarchy-level-view.png
Member Captions and Member Descriptions generally represent detailed labels for objects. These are typically end-user-friendly names. For example, you can caption a hierarchy representing geography areas named GEOGRAPHY_HIERARCHY as “Geography” and specify its description as “Geographic areas such as cities, states, and countries.”
To see the measures for the Analytic View, click Measures tab. To immediately create the Analytic View, click Create. To cancel the creation, click Cancel.
View and Manage Measures
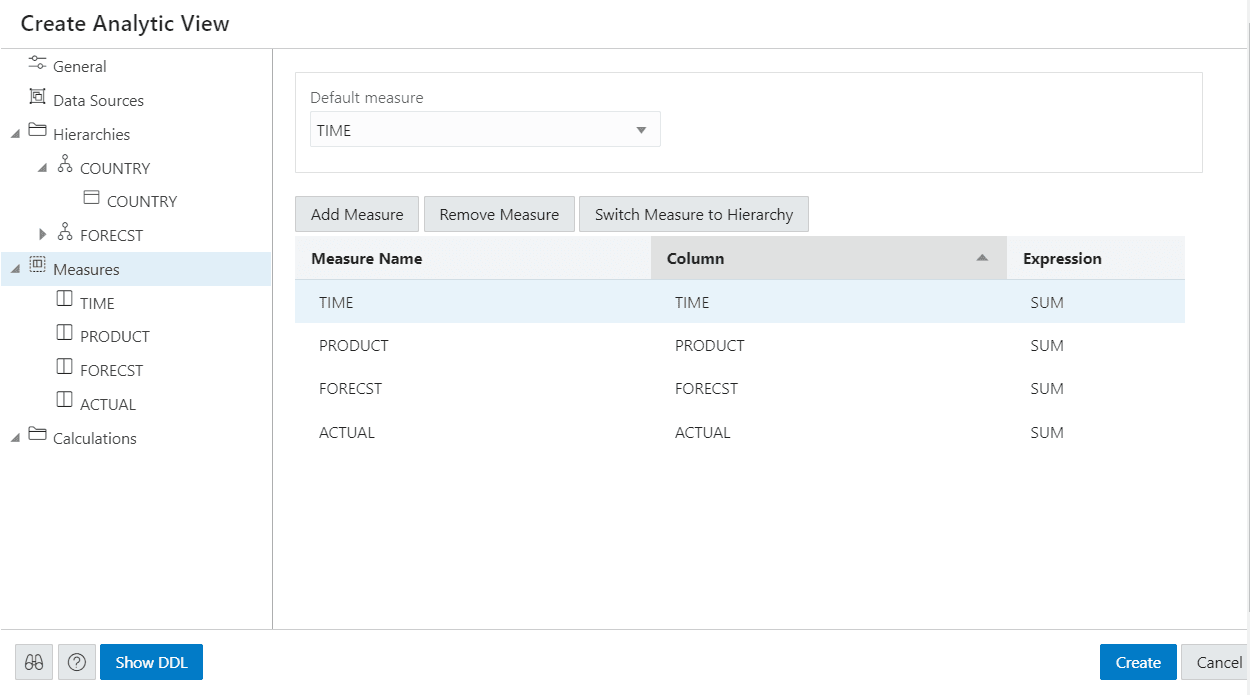
The Measures tab displays the measures suggested for the Analytic View. It displays the Measure Name, Column, and operator Expression for each measure.
The measures specify fact data and the calculations or other operations to perform on the data.
To add measures, click Add Measure. You can view a new measure at the bottom of the measures list. To remove the measure, select the measure you want to remove from the list and click Remove Measure.
Description of the illustration measures-tab.png
To alternatively add a measure from the data source, right- click the Measures tab. This pops up a list of columns that can be used as measures. Select one measure from the list.
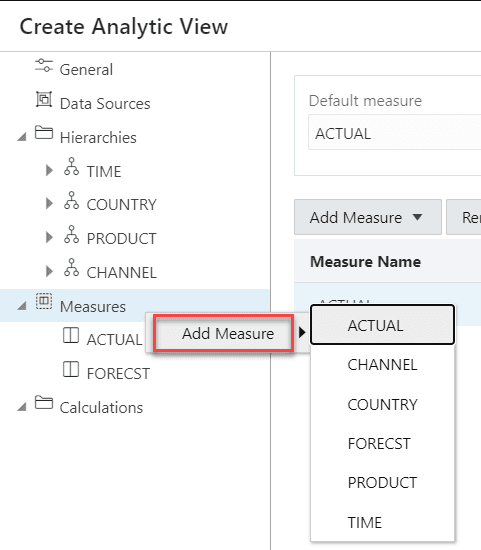
Description of the illustration add-measure.png
You can exclude a column from the measures on right-clicking the Measures tab and selecting Remove Measure.
Click Switch Measure to Hierarchy to change the measure you select to hierarchy in the Hierarchies list.
You must specify a measure as the default measure for the analytic view; otherwise, the first measure in the definition is the default. Select Default Measure from the drop-down.
To add a measure, right-click the Measures tab and select Add Measure. To remove a measure, select the particular measure you want to remove, right-click on it and select Remove Measure.
You can select a different column for a measure from the Column drop-down list. You can select a different operator from the Expression drop-down list.
In creating an analytic view, you must specify one or more hierarchies and a fact table that has at least one measure column and a column to join to each of the dimension tables outside of the fact table.
Create new calculated measures
You can add measure calculations to a query of an analytic view.
The measures and hierarchies associated with the analytic views enable us to create new calculated measures.
Calculated measures return values from data stored in one or more measures. You compute these measures at run time.
Note: You can create the measures without increasing the size of the database since the calculated measures do not store the data. However, they may slow performance. You need to decide which measures to calculate on demand.
The Analytic Views provides easy-to-use templates for creating calculated measures.
Once you create a calculated measure, it appears in the list of measures of the Analytic View .You can create a calculated measure at any time which is available for querying in SQL.
The Data Analysis tool provides easy-to-use templates for creating calculated measures.
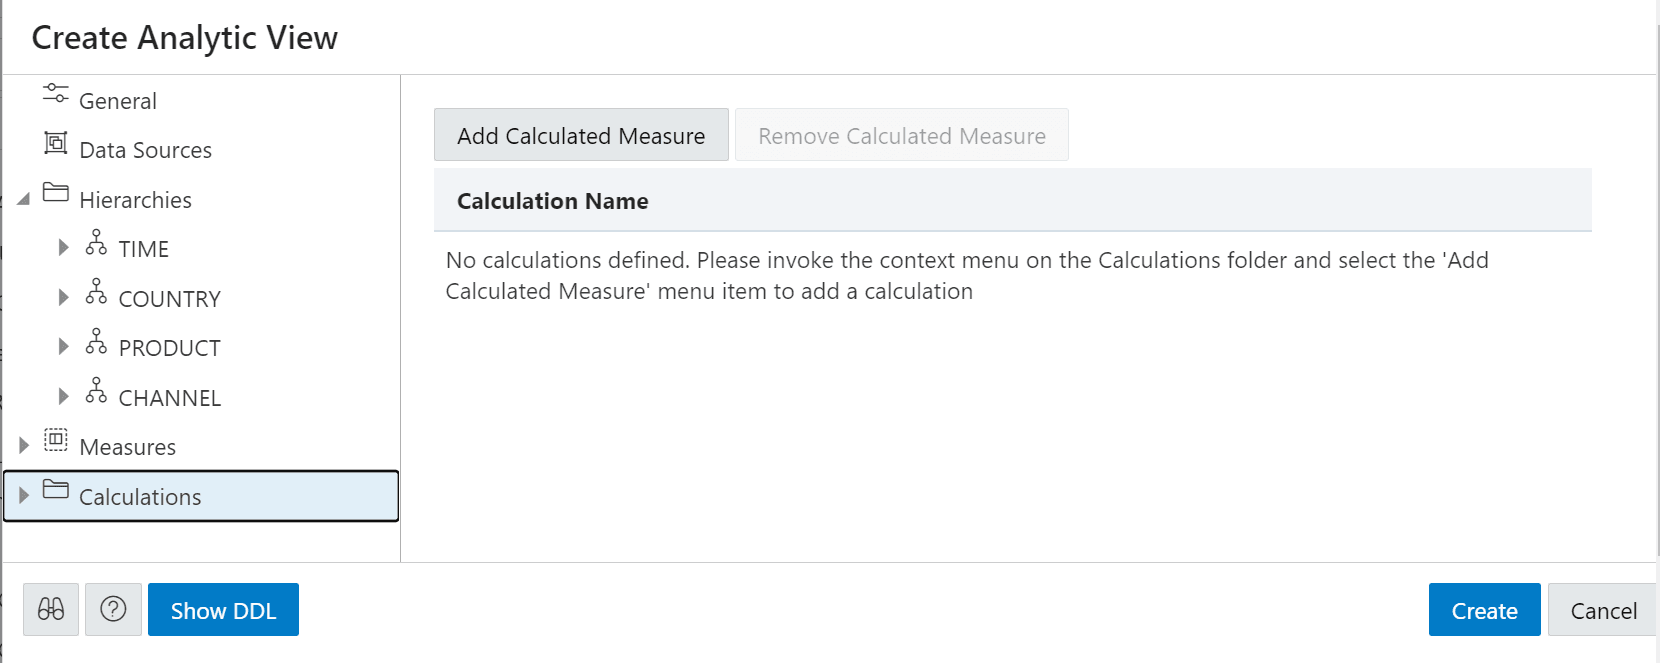
Description of the illustration add-calculated-measure.png
Click Add Calculated Measure to add calculations to the measures. You can view the new calculation with system generated name in the Calculations tab.
Click the newly created calculated measure.
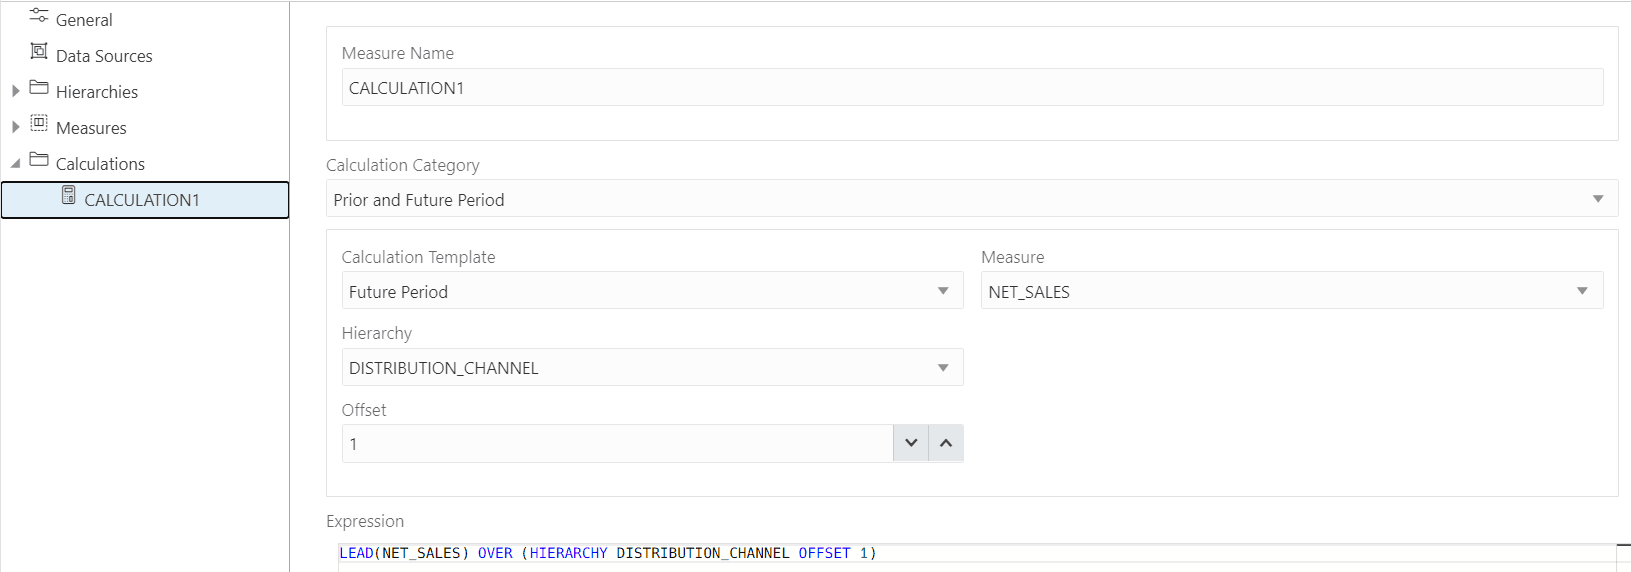
Description of the illustration calculated-measure-dialogbox.png
In the Measure Name field, enter the name of the calculated measure.
You can select preferred category of calculation from a list of options such as Prior and Future Period, Cumulative Aggregates, Period To Date, Parallel Period, Moving Aggregates, Share, Qualified Data Reference, and Ranking using the Calculation Category drop-down.
Your choice of category of calculation dynamically changes the Calculation Template.
For more details on how to use Calculation templates, see Using Calculation Templates.
Select the Measure and Hierarchy on which you want to base the calculated measures.
Select Offset value by clicking the up or the down arrow. The number specifies the number of members to move either forward or backward from the current member. The ordering of members within a level is dependent on the definition of the attribute dimension used by the hierarchy. The default value is 0 which represents POSITION FROM BEGINNING.
The Expression field lists the expressions which the calculated measure uses.
On the creation of the Analytic view, the calculated measure appears in the navigation tree in the Calculated Measures folder.
Click Create. A confirmation dialog box appears that asks for your confirmation. Select Yes to proceed with the creation of Analytic View.
After creating the Analytic View, you will view a success message informing you of its creation.
On editing the Analytic View you create, you can view the calculated measure in the navigation tree in the Calculations folder.
Click the Tour icon for a guided tour of the worksheet highlighting salient features and providing information if you are new to the interface.
Click the help icon to open the contextual or online help for the page you are viewing.
Click Show DDL to generate Data Definition Language statements for the analytic view.
Edit Analytic View
You might want to edit an Analytic View to make changes to the data sources, the hierarchies, or the measures.
To edit an Analytic View, click the Action icon on the Analytic View item, then click Edit Analytic View. On the Edit Analytic View screen, select a tab and make changes as desired.
When you have completed the changes, click Update.