Monitor Performance with Autonomous AI Database Metrics
You can monitor the health, capacity, and performance of your databases with metrics, alarms, and notifications. You can use Oracle Cloud Infrastructure Console or Monitoring APIs to view metrics.
View Metrics for an Autonomous AI Database Instance
Shows the steps to view the Autonomous AI Database metrics.
To view metrics you must have the required access as specified in an Oracle Cloud Infrastructure policy (whether you’re using the Console, the REST API, or another tool). See Getting Started with Policies for information on policies.
Perform the following steps as necessary:
-
Open the Oracle Cloud Infrastructure Console by clicking the
 next to Cloud.
 -
From the Oracle Cloud Infrastructure left navigation menu click Oracle AI Database and then click Autonomous AI Database.
-
On the Autonomous AI Databases page select an Autonomous AI Database from the links under the Display name column.
To view metrics for an Autonomous AI Database instance:
-
On the Autonomous AI Database Details page, select the Monitoring tab.
-
There is a chart for each metric. In each chart you can select the Interval and Statistic or use the default values.
Note: The following table shows the default metrics shown on the Oracle Cloud Infrastructure Console Monitoring tab. See Available Metrics: oci_autonomous_database for a list of all the database metrics and dimensions.
| Metric Name | Description |
|---|---|
| CPU utilization | CPU utilization expressed as a percentage, aggregated across all consumer groups. The utilization percentage is reported with respect to the number of CPUs the database is allowed to use, which is the number of ECPUs. If your database uses OCPUs, the number of CPUs allowed is two times the number of OCPUs. |
| Storage utilization | The percentage of provisioned storage capacity currently in use. Represents the total allocated space for all tablespaces. |
| Sessions | The number of sessions in the database. |
| Execute count | The number of user and recursive calls that ra SQL statements during the selected interval. |
| Running statements | The number of running SQL statements, aggregated across all consumer groups, during the selected interval. |
| Queued statements | The number of queued SQL statements, aggregated across all consumer groups, during the selected interval. |
| Database availability | The database is available for connections during the selected time interval (data for this metric lags by 5 minutes). Possible values for this metric:
You can set an alarm that is triggered if the database is not available (value 0). Note: Availability is calculated using failed connections due to |
| Failed connections | Shows the total number of failed connections to the database during the selected interval. A connection is counted as failed when a connection attempt reaches the database and logs any of the following errors: |
To create an alarm on a metric, in a metric chart or table, select ![]() and in the menu select Create an alarm on this query. See Managing Alarms for information on setting and using alarms.
and in the menu select Create an alarm on this query. See Managing Alarms for information on setting and using alarms.
For more information about metrics see Available Metrics: oci_autonomous_database.
You can also use the Monitoring API to view metrics. See Monitoring API for more information.
View Logs and Audit Trails
Shows the steps to view the Autonomous AI Database logs and audit trails.
Note: To view logs and audit trials you must have the required access as specified in an Oracle Cloud Infrastructure policy (whether you’re using the Console, the REST API, or another tool). See Getting Started with Policies for information on policies.
To view audit trails and logs for an Autonomous AI Database instance:
-
On the Details page, select the Monitoring tab.
-
On the Monitoring tab, click the view audit and logs link.
-
In the Logging area, click Logs to view log information.
-
In the logging area, click Audit to view audit information.
-
See Audit Autonomous AI Database and Audit Logs for more information.
View Metrics for Autonomous AI Databases in a Compartment
Shows the steps to view metrics for Autonomous AI Databases in a compartment.
To view metrics you must have the required access as specified in an Oracle Cloud Infrastructure policy (whether you’re using the Console, the REST API, or other tool). See Getting Started with Policies for information on policies.
-
Open the Oracle Cloud Infrastructure Console by clicking the
next to Cloud. -
From the left navigation list click Observability & Management. Under Monitoring, click Service Metrics.
To use the metrics service to view Autonomous AI Database metrics:
-
On the Service Metrics page, under Compartment select your compartment.
-
On the Service Metrics page, under Metric Namespace select oci_autonomous_database.
-
If there are multiple Autonomous AI Databases in the compartment you can show metrics aggregated across the Autonomous AI Databases by selecting Aggregate Metric Streams.
-
If you want to limit the metrics you see, next to Dimensions click Add (click Edit if you have already added dimensions).
-
In the Dimension Name field select a dimension.
-
In the Dimension Value field select a value.
-
Click Done.
In the Edit dimensions dialog click +Additional Dimension to add an additional dimension. Click x to remove a dimension.
-
To create an alarm on a specific metric, click Options and select Create an Alarm on this Query. See Managing Alarms for information on setting and using alarms.
Autonomous AI Database Metrics and Dimensions
You can limit the instances where you see metrics with dimensions. The available dimensions include: workload type, instance display name, region, and the instance OCID.
Use dimensions by selecting values in the Oracle Cloud Infrastructure Console Service Metrics page or by setting dimension values with the API. See View Metrics for Autonomous AI Databases in a Compartment to view metrics and to select metric dimensions.
Use Custom Metrics on Autonomous AI Database
Describes how to create and publish custom metrics on Autonomous AI Database.
Autonomous AI Database provides many database related metrics that are available through the OCI Monitoring service. In addition, you can create custom metrics to collect, publish, and analyze your own metrics. A custom metric collects specified data from your Autonomous AI Database instance and publishes the data to the OCI Monitoring service using a REST API provided by the OCI SDK.
Prerequisites
-
Obtain Oracle Cloud Infrastructure access through Oracle Cloud Free Tier or a paid Cloud Account.
See Get an Oracle Cloud Account for more information.
-
Create an Autonomous AI Database instance or have access to an existing Autonomous AI Database instance.
See Provision an Autonomous AI Database Instance for more information.
-
Obtain ADMIN credentials for your Autonomous AI Database instance.
-
Use Database Actions or any of the Oracle AI Database clients, such as SQL Developer or SQL*Plus to connect to the database.
See Connect to Autonomous AI Database for more information.
-
You need access to the OCI Monitoring service and OCI Identity and Access Management.
See Publishing Custom Metrics Using the API for more information.
Overview of Custom Metrics with OCI Monitoring Service
The following figure shows the steps to create and publish custom metrics on Autonomous AI Database. This shows that you collect metric data with a script running on your Autonomous AI Database instance and you publish this data to the OCI Monitoring service, and how you can create alarms and notifications for metric values.
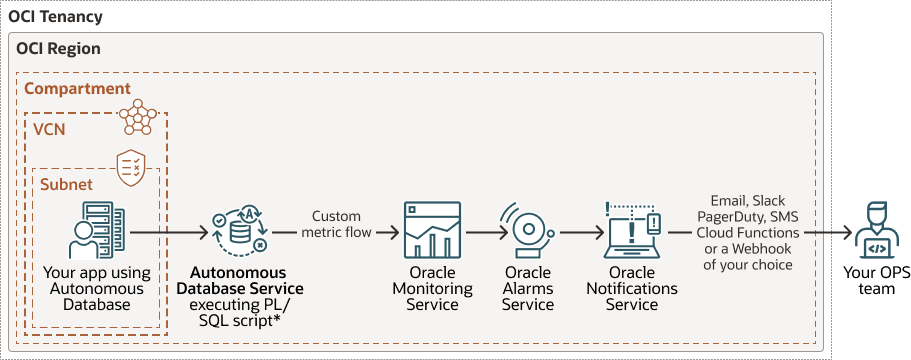
Description of the illustration autonomous-database-custom-metrics.png
-
Create and deploy a PL/SQL script on your Autonomous AI Database instance. This script runs periodically to compute, collect, and publish custom metrics to the OCI Monitoring service.
-
The Autonomous AI Database instance can be on a public or on a private endpoint. The communication between the Autonomous AI Database instance and the OCI Monitoring service takes place on the Oracle Cloud network. This means, to publish metrics on the OCI Monitoring service you do not need to create a service gateway.
Create and Publish Custom Metrics
To create and publish custom metrics:
-
In OCI Identity and Access Management create a dynamic group for your Autonomous AI Database instance and create a policy to authorize the dynamic group to post metrics to the OCI Monitoring service.
For example:
-
In the Oracle Cloud Infrastructure console click Identity & Security.
-
Under Identity click Domains and select an identity domain (or create a new identity domain).
-
Under Identity domain, click Dynamic groups.
-
Click Create dynamic group and enter a Name, a Description, and a rule.
For example, create a dynamic group named
adb_dgfor your Autonomous AI Database instance and create a rule:ALL {resource.type = 'autonomousdatabase', resource.compartment.id = 'OCID_of_compartment'}Alternatively, you can select a single Autonomous AI Database instance instead of all the instances in the compartment:
ALL {resource.type = 'autonomousdatabase', resource.id = 'OCID_of_autonomousdatabase_instance'}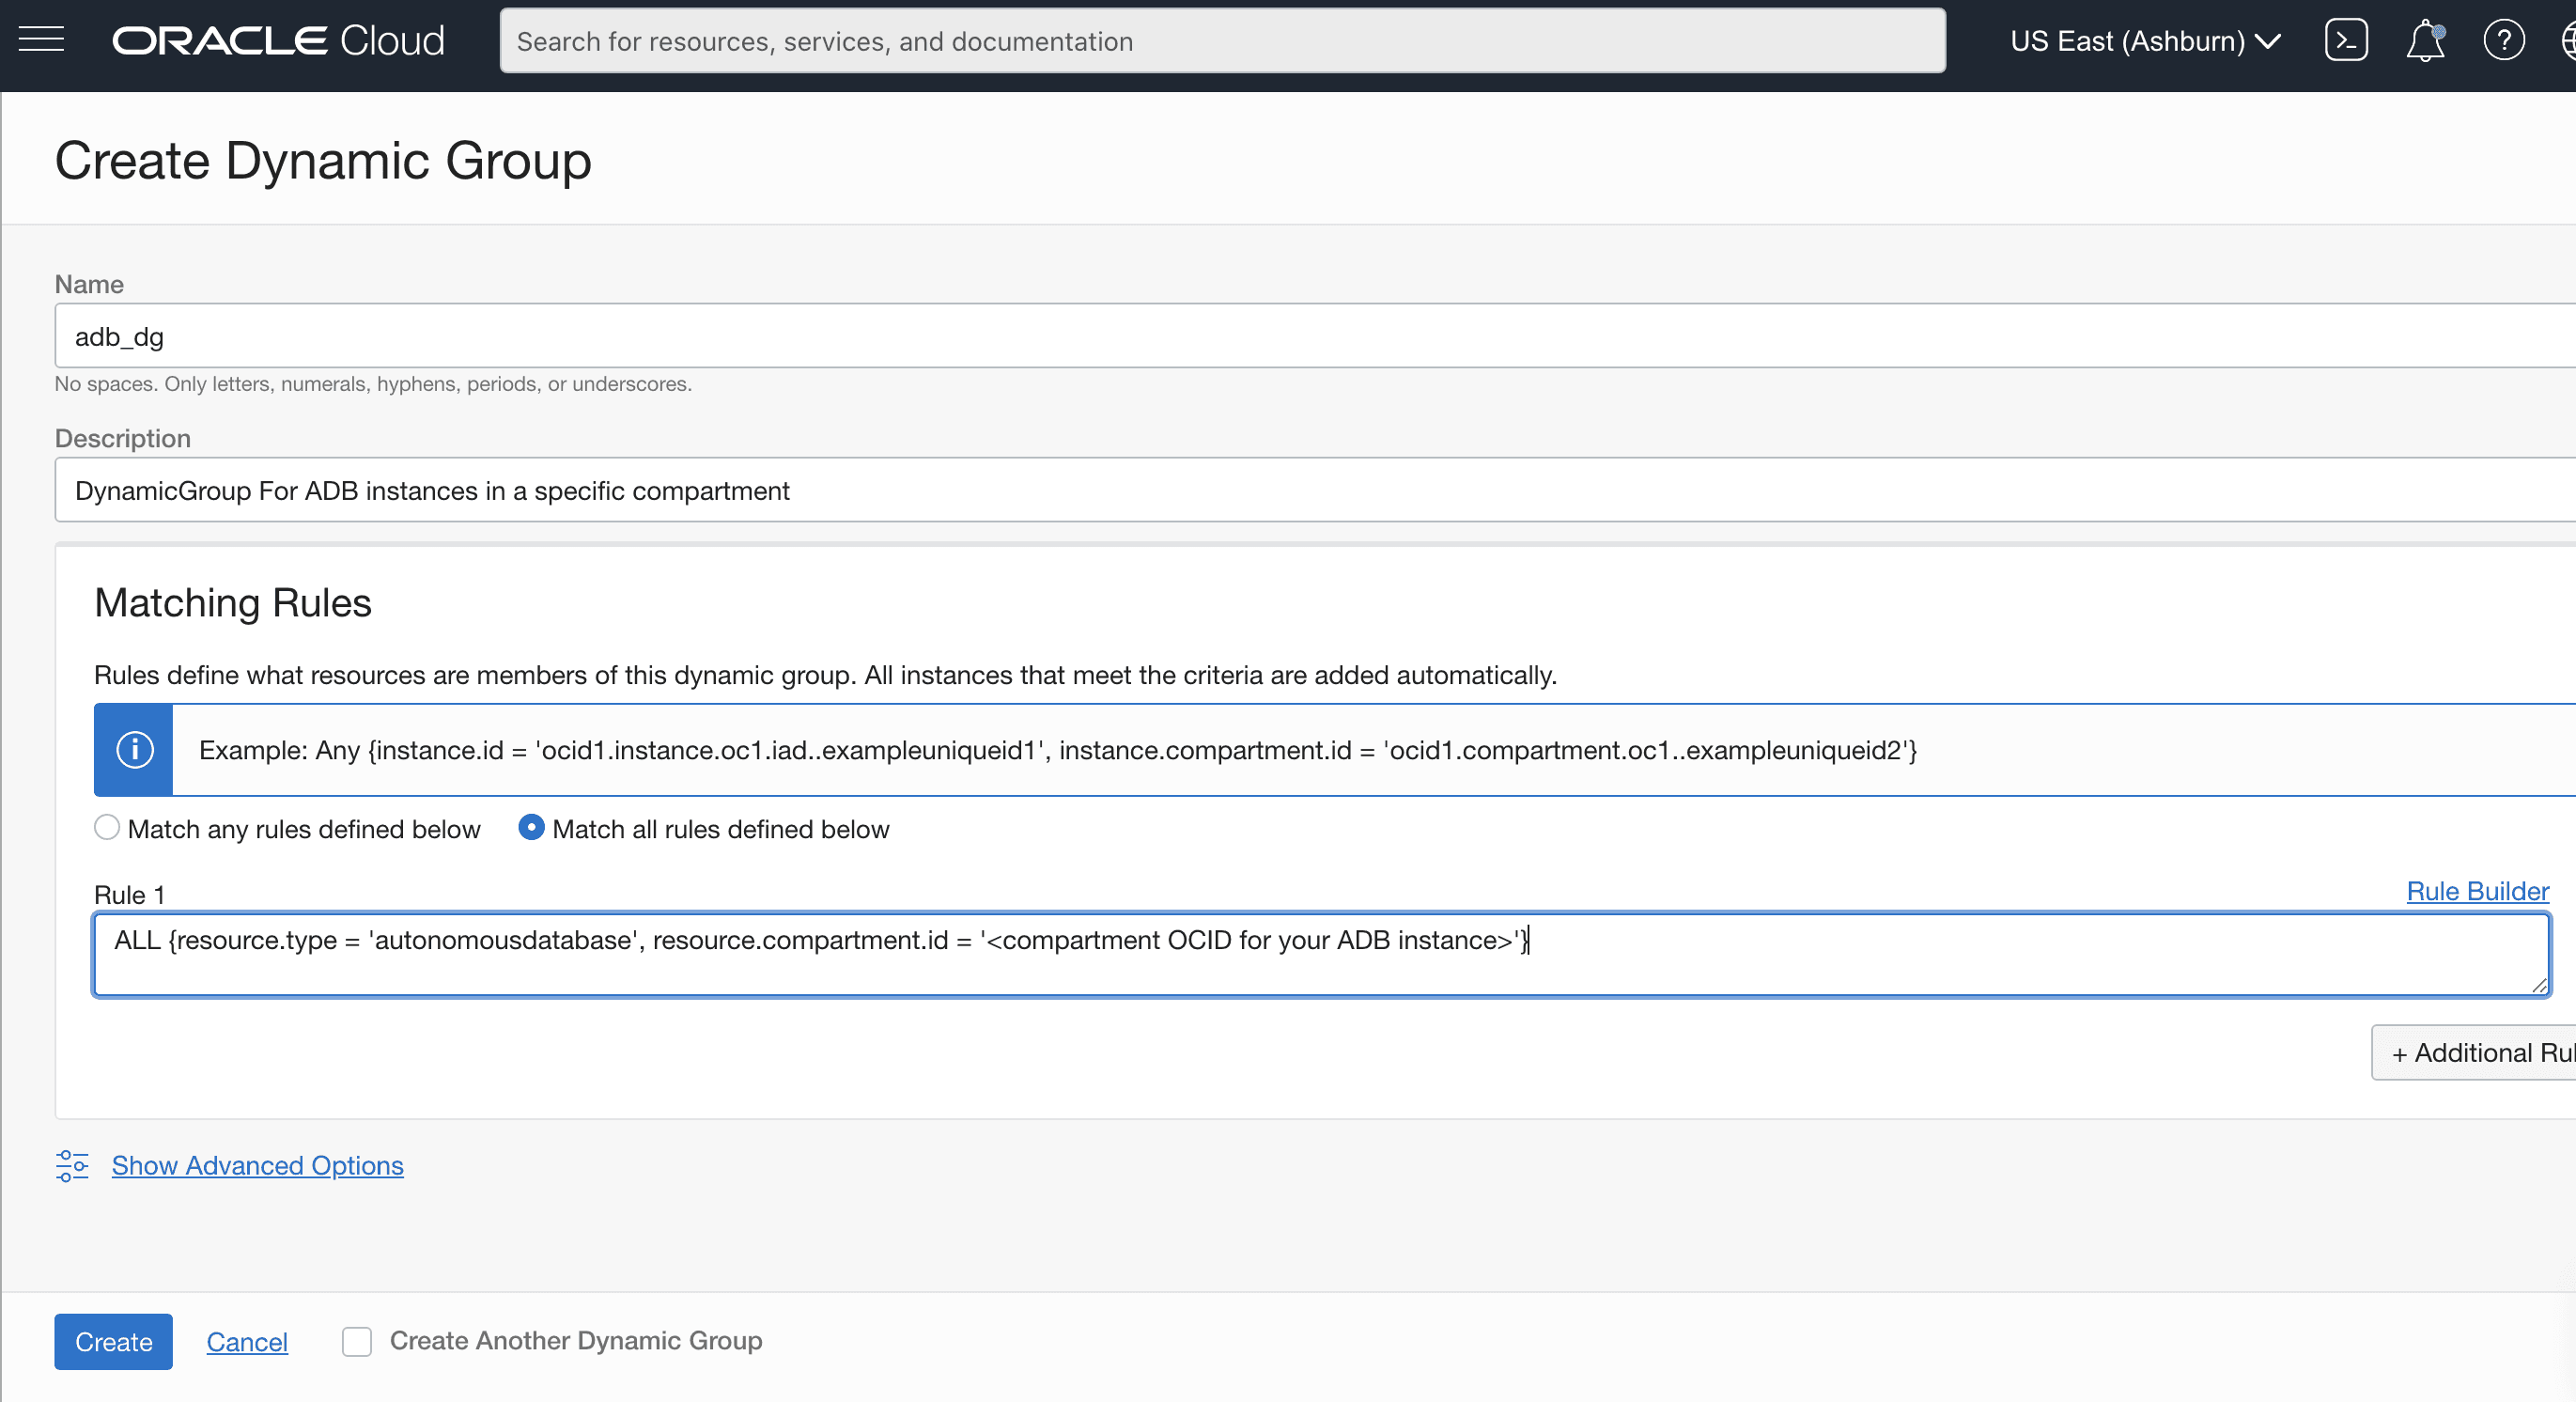
Description of the illustration adb_custom_metrics_dynamic_group.png
-
Click Create.
-
Create an OCI Identity and Access Management (IAM) policy to authorize the dynamic group.
For example, create a policy to authorize the dynamic group
adb_dgto post metrics to the OCI Monitoring service with the policyadb_dg_policy:Allow dynamic-group adb_dg to use metrics in compartment OCID_of_compartment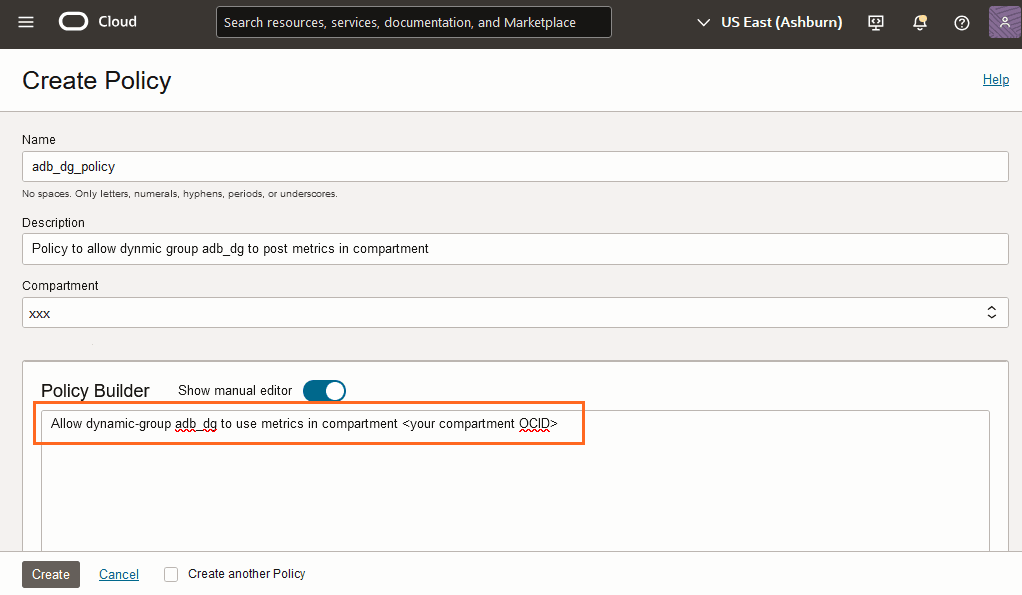
Description of the illustration adb_custom_metrics_policy.png
After you define the policy, the dynamic group with the definition
adb_dgis authorized to post metrics in the compartment.At this point, the PL/SQL routine running on Autonomous AI Database can’t post any metrics to the OCI Monitoring service because there are no Autonomous AI Database users authorized to publish metrics to the OCI Monitoring service. You provide this capability when you enable the resource principal in the following step (step 2c).
-
-
Create a new database user or schema with the requisite privileges in your Autonomous AI Database instance or update an existing database user or schema with the requisite privileges.
For example:
-
Create a database user or use an existing user to publish metrics. .
For example, create a new user
ECOMMERCE_USERon the Autonomous AI Database instance:CREATE USER ECOMMERCE_USER IDENTIFIED BY "password";Now you have the new user
ECOMMERCE_USER. The following steps are the same with this user or with the user you specify. However if you create a user with a different name you need to replaceECOMMERCE_USERwith the alternative user name. -
Grant requisite Oracle AI Database related privileges to the user.
GRANT CREATE TABLE, ALTER ANY INDEX, CREATE PROCEDURE, CREATE JOB, SELECT ANY TABLE, EXECUTE ANY PROCEDURE, UPDATE ANY TABLE, CREATE SESSION, UNLIMITED TABLESPACE, CONNECT, RESOURCE TO ECOMMERCE_USER; GRANT SELECT ON "SYS"."V_$PDBS" TO ECOMMERCE_USER; GRANT EXECUTE ON "C##CLOUD$SERVICE"."DBMS_CLOUD" to ECOMMERCE_USER; GRANT SELECT ON SYS.DBA_JOBS_RUNNING TO ECOMMERCE_USER; -
Enable Oracle AI Database credentials for the Oracle Cloud Resource Principal and give access to the user.
This step connects the dynamic group
adb_dgyou created in step 1 to the database userECOMMERCE_USER, giving the user authorization to post metrics to the OCI Monitoring service.For example:
EXEC DBMS_CLOUD_ADMIN.ENABLE_RESOURCE_PRINCIPAL(username => 'ECOMMERCE_USER');See Use Resource Principal to Access Oracle Cloud Infrastructure Resources for more information.
As an alternative to Resource Principal authentication, you can use OCI Native credentials for authentication. See CREATE_CREDENTIAL Procedure for more information.
-
(Optional) Verify the operations you completed in the previous step.
For example:
SELECT OWNER, CREDENTIAL_NAME FROM DBA_CREDENTIALS WHERE CREDENTIAL_NAME = 'OCI$RESOURCE_PRINCIPAL' AND OWNER = 'ADMIN';To check if a user other than ADMIN has access to OCI Resource Principal, for example to check if the
ECOMMERCE_USERhas access to the database credential, use theDBA_TAB_PRIVSview:SELECT * FROM DBA_TAB_PRIVS WHERE DBA_TAB_PRIVS.GRANTEE='ECOMMERCE_USER';
-
-
Create a PL/SQL script that publishes metric data and schedule the script to run on your Autonomous AI Database instance.
-
For example, create a PL/SQL script with a metric that counts of the rows of the Star Schema Benchmark sample data and publishes to the OCI Monitoring service.
CREATE OR REPLACE PROCEDURE publish_lineorder_metric (p_sql_statement IN VARCHAR2)
IS
l_result NUMBER;
l_compartment_ocid VARCHAR2(255);
l_db_name VARCHAR2(255);
l_region VARCHAR2(255);
l_json_payload CLOB;
l_cloud_identity CLOB;
BEGIN


-- 1. Execute the SQL statement and get the result

EXECUTE IMMEDIATE p_sql_statement INTO l_result;


 -- 2. Get compartment OCID, DB name, and region from cloud identity

 SELECT cloud_identity INTO l_cloud_identity FROM v$pdbs;

 l_compartment_ocid := JSON_VALUE(l_cloud_identity, '$.COMPARTMENT_OCID');
 l_db_name := JSON_VALUE(l_cloud_identity, '$.DATABASE_NAME');
 l_region := JSON_VALUE(l_cloud_identity, '$.REGION');

DBMS_OUTPUT.PUT_LINE(l_cloud_identity);


 -- 3. Construct the JSON payload for the metric

 l_json_payload :=
 '{' ||
 ' "metricData": [' ||
 ' {' ||
 ' "namespace": "custom_metrics",' ||
 ' "compartmentId": "' || l_compartment_ocid || '",' ||
 ' "name": "lineorder_metric",' ||
 ' "dimensions": {' ||
 ' "dbName": "' || l_db_name || '"' ||
 ' },' ||
 ' "datapoints": [' ||
 ' {' ||
 ' "timestamp": "' || TO_CHAR(SYSTIMESTAMP AT TIME ZONE 'UTC', 'YYYY-MM-DD"T"HH24:MI:SS.FF3"Z"') || '",' ||
 ' "value": ' || l_result ||
 ' }' ||
 ' ]' ||
 ' }' ||
 ' ]' ||
 '}';


 -- 4. Publish the metric using DBMS_CLOUD.SEND_REQUEST

 DECLARE
 l_response DBMS_CLOUD_TYPES.resp;
 BEGIN
 l_response := DBMS_CLOUD.SEND_REQUEST(
 credential_name => 'OCI$RESOURCE_PRINCIPAL',
 uri => 'https://telemetry-ingestion.' || l_region || '.oraclecloud.com/20180401/metrics',
 method => 'POST',
 body => UTL_RAW.CAST_TO_RAW(l_json_payload)
 );

 -- 5. Check response status

 IF DBMS_CLOUD.GET_RESPONSE_STATUS_CODE(l_response) = 200 THEN
 DBMS_OUTPUT.PUT_LINE('Metric published successfully!');
 ELSE
 DBMS_OUTPUT.PUT_LINE('Error publishing metric: ' || DBMS_CLOUD.GET_RESPONSE_STATUS_CODE(l_response));
 DBMS_OUTPUT.PUT_LINE(DBMS_CLOUD.GET_RESPONSE_TEXT(l_response));
 END IF;

 EXCEPTION
 WHEN OTHERS THEN
 DBMS_OUTPUT.PUT_LINE('Error during SEND_REQUEST: ' || SQLERRM);
 END;
EXCEPTION
 WHEN OTHERS THEN
 DBMS_OUTPUT.PUT_LINE('Error: ' || SQLERRM);
END;
/
See PostMetricData for more information.
-
Schedule a job to call and publish the custom metric data point once per minute. In production the schedule would be configured to run according to your needs.
BEGIN
   DBMS_SCHEDULER.CREATE_JOB (
      job_name => 'publish_lineorder_count_job',
      job_type => 'STORED_PROCEDURE',
      job_action => 'ECOMMERCE_USER.publish_lineorder_metric',
      number_of_arguments => 1,
      start_date => SYSTIMESTAMP,
      repeat_interval => 'FREQ=MINUTELY;INTERVAL=1',
      enabled => FALSE,
      AUTO_DROP => FALSE,
      comments => 'Publishes the count of rows in SSB.LINEORDER every 1 minute'
);

  DBMS_SCHEDULER.SET_JOB_ARGUMENT_VALUE (
       job_name => 'publish_lineorder_count_job',
       argument_position => 1,
       argument_value => 'SELECT COUNT(*) FROM SSB.LINEORDER'
 );

   DBMS_SCHEDULER.ENABLE('ECOMMERCE_USER.PUBLISH_LINEORDER_COUNT_JOB');
END;
-
-
Explore the published custom metrics on the Metrics Explorer.
-
From the Oracle Cloud Infrastructure Console navigation menu, click Observability & Management.
-
Under Observability & Management, click Metrics Explorer.
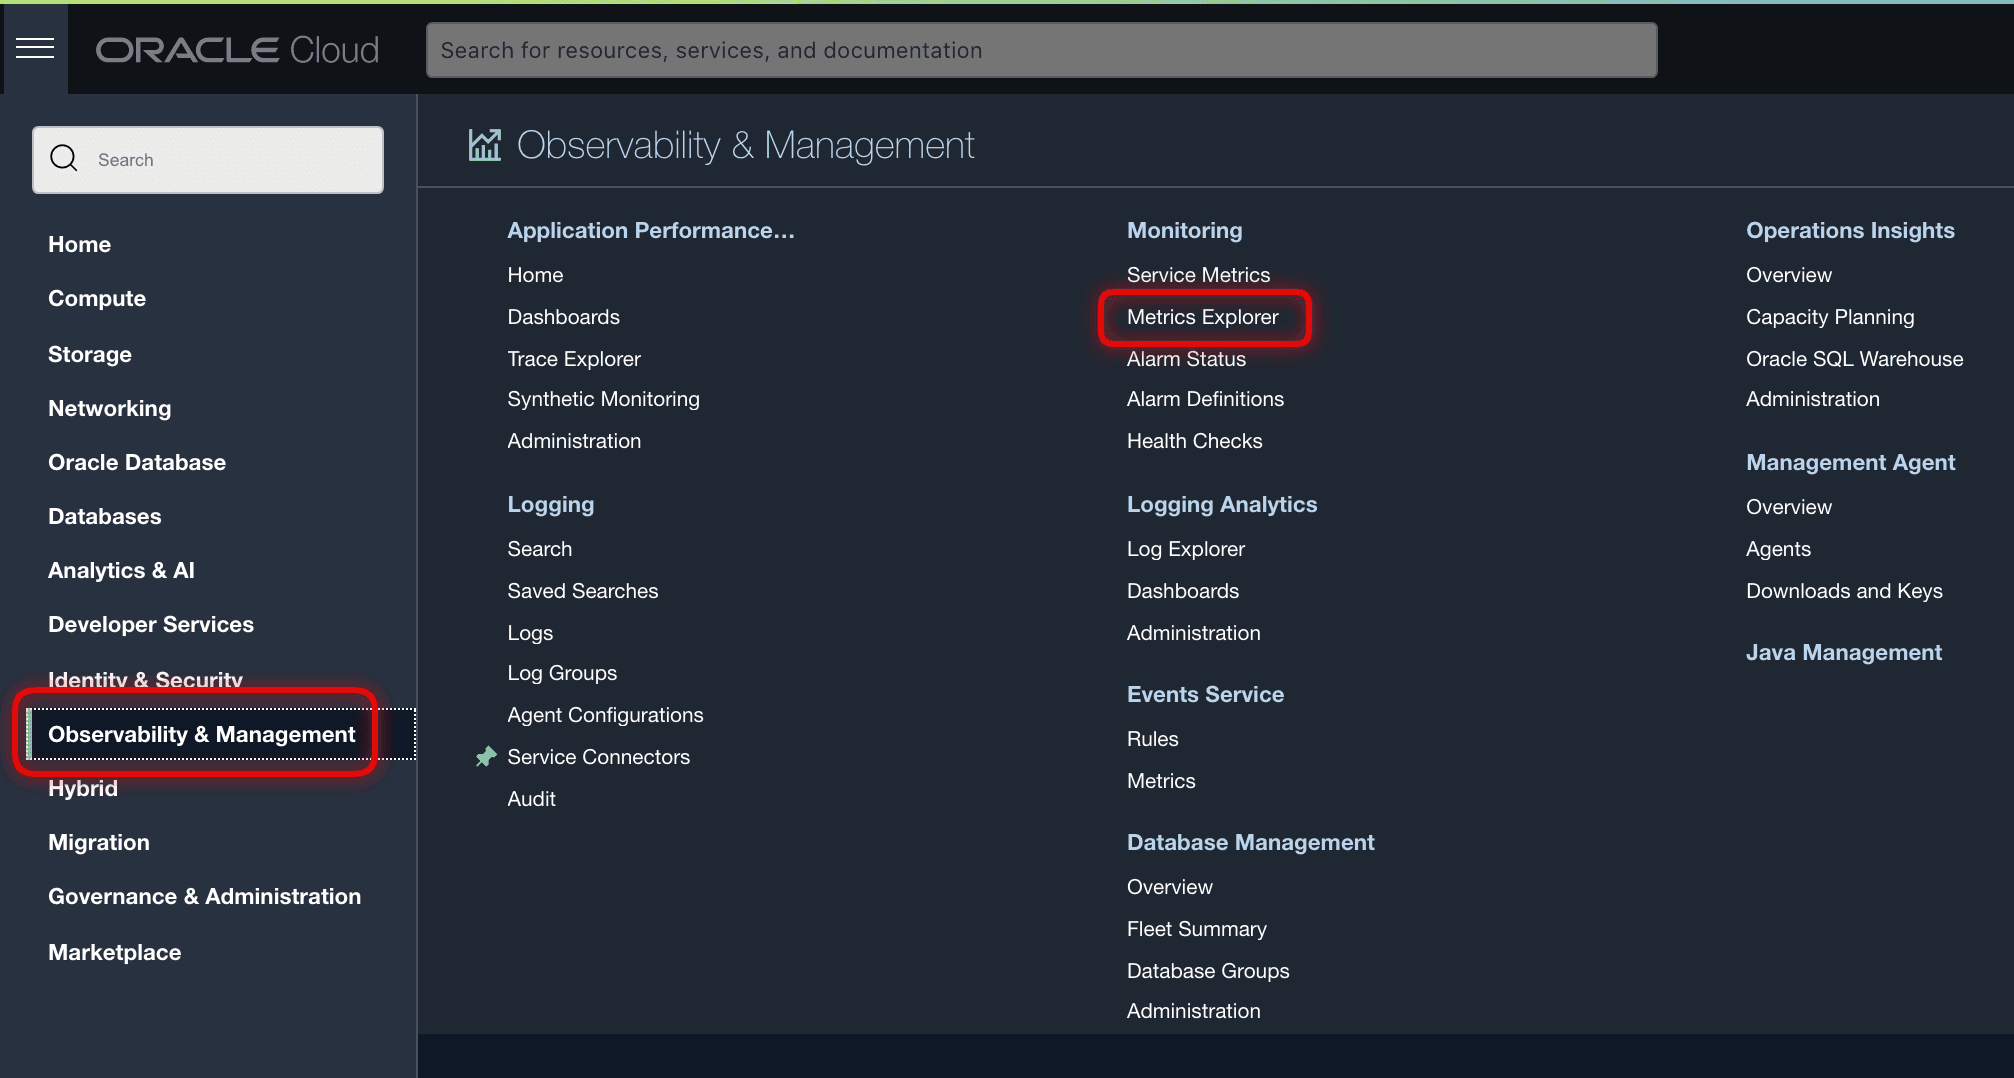
Description of the illustration adb_custom_metrics_explore.png
-
In Metrics Explorer, select the namespace as
custom_metrics_from_adb,resourceGroupasecommerece_adb, and metric name aslineorder_metric(the name of the metric you created in the PL/SQL script).All the metadata and dimensions you set for custom metrics are available. You can construct Metrics Query Language (MQL) queries to analyze these metrics according to your needs and use case. You may also set up Oracle Cloud Alarms on the metric stream to alert your operational team. This automates the observability loop for the Autonomous AI Database metrics of your choice. Note that in the Metrics Explorer the metric screen by default shows graph view and you have the option to enable list view to highlight data points.
-
After you create custom metrics you can use the metrics just like any predefined metrics in OCI Monitoring service. This means you can analyze custom metrics with the Metrics Query Language (MQL) and set up alarms and notifications to notify you whenever an event of interest occurs.
See the following for more information: