Plot Geometries
The plot_geometries function in
oraclesai.vis can take the exact parameters of the
plot function of a GeoDataFrame. Additionally, it
supports data from a SpatialDataFrame or GeoDataFrame by
specifying the data parameter.
See the plot_geometries function in Python API Reference for Oracle Spatial AI for more information.
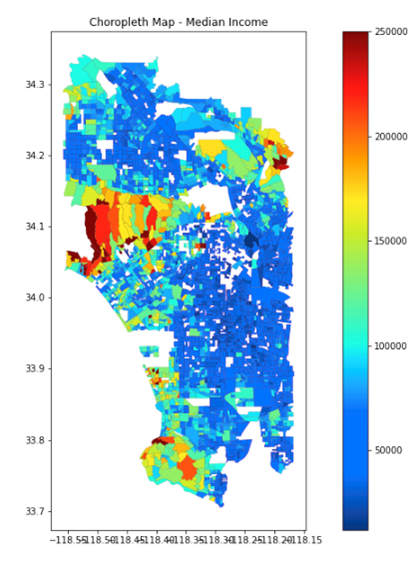
The following example displays a map with the geometries in the
block_groups
SpatialDataFrame with the color representing the value of the
MEDIAN_INCOME column.
import matplotlib.pyplot as plt
from oraclesai.vis import plot_geometries

fig, ax = plt.subplots(figsize=(15,10))

# Set the titles
ax.set_title('Choropleth Map - Median Income');

# Plot the choropleth map
plot_geometries(data=block_groups, ax=ax, column=block_groups["MEDIAN_INCOME"].values, cmap=plt.get_cmap("jet"), legend=True, edgecolor='black', linewidth=0.1 )
The output is as shown:
