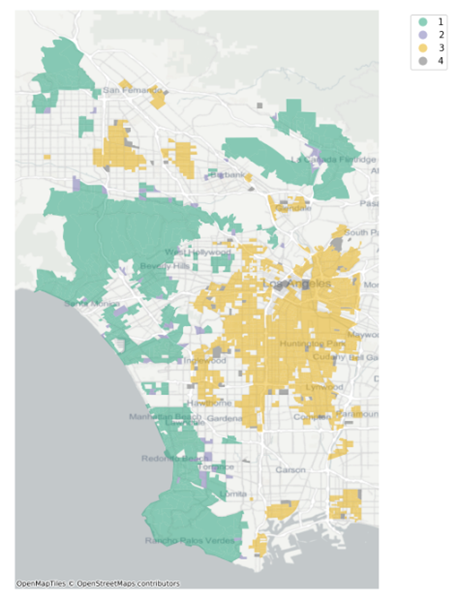
Plot Clusters
The plot_clusters function in
oraclesai.vis allows you to associate geometries and labels, and
display this association in a map.
The function works with data from SpatialDataFrame or
GeoDataFrame.
The following table describes the main parameters of the plot_clusters
function.
| Parameter | Description |
|---|---|
X |
The data with the geometries. It can be either a
SpatialDataFrame or a
GeoDataFrame.
|
labels |
The labels associated with X. Each observation in
X has a label assigned to it.
|
background_data |
A SpatialDataFrame or a
GeoDataFrame with its geometries as
background.
|
crs |
Indicates the coordinate reference system to be used for plotting. By
default, it uses X.crs.
|
with_bounds |
If True, each cluster is displayed with an enclosed
polygon.
|
with_noise |
If False, all the observations with the label –1 are
ignored. Otherwise, the observations are assigned to a cluster.
|
with_legend |
If True, a legend indicating the cluster’s labels is
displayed.
|
with_basemap |
If True, the default basemap is displayed. If a
TileProvider instance is passed, it uses it as the
basemap. Alternatively, it can also take a dictionary with the
oracles.vis.add_basemap parameters except
ax.
|
See the plot_clusters function in Python API Reference for Oracle Spatial AI for more information.
The following example trains a clustering model with a
LISAHotspotClustering instance using the
MEDIAN_INCOME column. It then displays the geometries and the
corresponding labels using the plot_clusters function in a map.
import matplotlib.pyplot as plt
from oraclesai.weights import KNNWeightsDefinition
from oraclesai.clustering import LISAHotspotClustering
from oraclesai.vis import plot_clusters

X = block_groups["MEDIAN_INCOME"]

# Define spatial weights
weights_definition = KNNWeightsDefinition(k=10)

# Create an instance of LISAHotspotClustering
lisa_model = LISAHotspotClustering(max_p_value=0.05,
                                   spatial_weights_definition=weights_definition)
# Train the model
lisa_model.fit(X)

fig, ax = plt.subplots(figsize=(12,12))
plot_clusters(X, lisa_model.labels_, with_noise=False, with_basemap=True, cmap='Dark2', ax=ax)
The output is as shown:
