- Using Oracle Big Data Preparation Cloud Service
- Blending Data
- Setting Conditions in Your Blending Configuration
Setting Conditions in Your Blending Configuration
Set conditions for a data blend by specifying which columns are blend keys manually or accepting system-generated recommendations, and viewing the confidence scores for them.
- In the Blending Configuration dialog box, select the Conditions tab if necessary. When the Blending Configuration dialog box loads, the Conditions tab is selected by default.
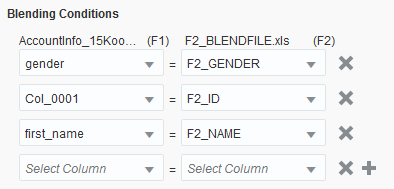
- Select the columns to be the blend keys for your data blend:
-
For each of the data files that you blend, select a column from the drop-down list that becomes the primary key. Click the Add
 or Remove
  icons to add or remove keys.

Description of the illustration blendingconditions_columnselect.png - Optionally, in the Blending Key Recommendations section, click the Accept
 icon next to the blending keys you that want to use in your data blend. These automated blending key recommendations are provided by the relationship discovery engine.
Description of the illustration blendingconditions_recommendations.png - Click the Show Details
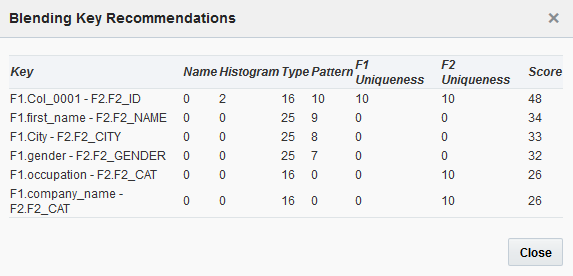
 icon to see the confidence score for the automated blending key recommendations that are provided by the relationship discovery engine, and then click Close.

Description of the illustration confidence_scores.pngThe confidence score consists of a multifaceted statistical analysis on all columns of each data set. The goal is to produce a few pairs of columns that are good candidates to be blend keys. Each of the following criteria is scored between 0 and 20 based on the likeliness that the pair is a good pair to be a blend key:
-
Name: The score is based on the similarity of the names of the two column headers.
-
Histogram: For columns containing numerical data, the score represents a statistical comparison of how similar the numerical values are between the two columns.
-
Type: This score represents a comparison of the data type and the extent of information that can be obtained from the data type in two columns. For example, a column that contains names of cities is meaningfully different than one that contains dates, decimal numbers, or addresses.
-
Pattern: This score represents a comparison of the character value patterns of two columns. For example, two columns may contain strings, but a column of email addresses that contain
@characters has a consistently different character pattern than a column that contains first names. -
F1 Uniqueness: This score measures the uniqueness of values that are in the left column. For example, a column with gender values of
ForMis less unique in comparison to a column that contains individual social security numbers. -
F2 Uniqueness: This score measures the uniqueness of values that are in the right-hand column.
-
-
- Select an output option:
- Rows matching both datasets: The processing engine returns only rows that contain a match to the blend keys.
- Left join: The processing engine returns all rows from the F1 (left) data set in addition to all rows from the F2 (right) data set that match the blend keys.
- Right join: The processing engine returns all rows from the F2 (right) data set in addition to all rows from the F1 (left) data set that match the blend keys.
- Click Submit.Your blend configuration is saved and the blend of two data files begins in the service cluster.
Note that an asterisk appears on the blending drop-down list and a green banner notifies you that the blend has started. When the process engine completes the blend, the asterisk on the blending drop-down list disappears, a blue banner notifies you that the blend is complete, and you can then go to the resulting blended file.
