Understand Service Details and Metrics
The Oracle Database Exadata Express Cloud Service provides the ability for you to monitor important metrics for your service.
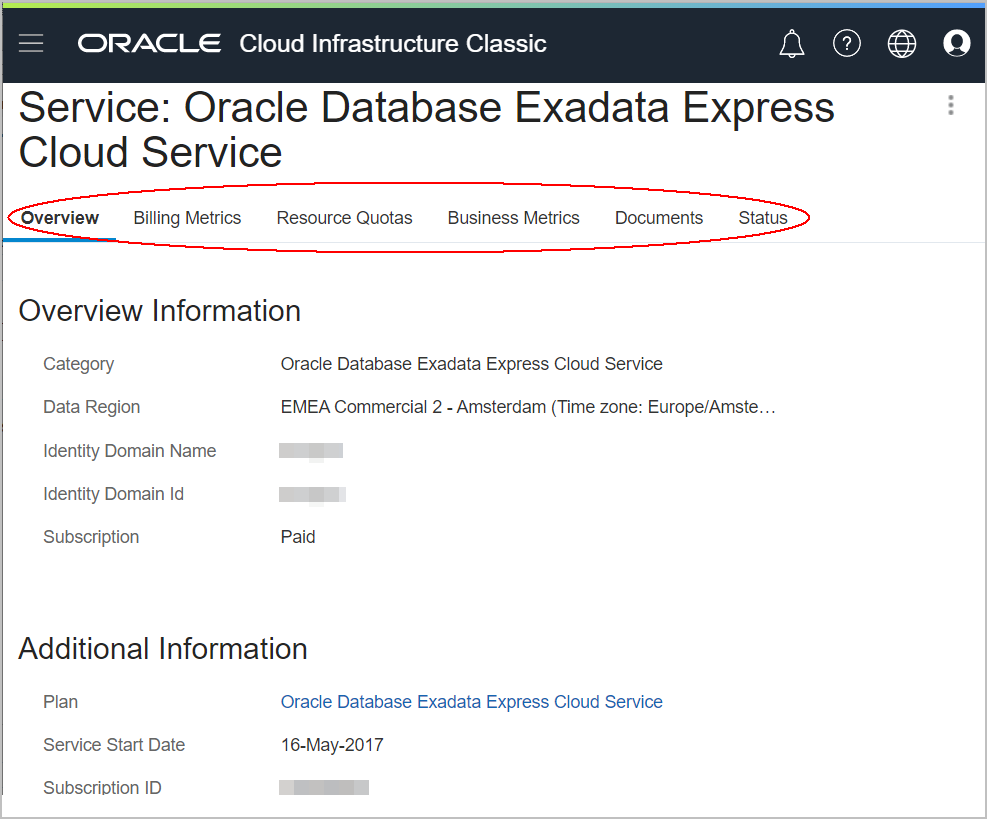
The Metrics available for the Oracle Database Exadata Express Cloud Service display on the left side of the page. To navigate to the Service Details for your service, see Access Service Details.

Description of the illustration eecs_metrics.png
-
Billing Metrics
For non-metered cloud accounts, this metric shows the prorated amount used of your entitlement per day. This number does not affect the amount you are billed for your subscription.
For metered cloud accounts, this metric shows the number of hours your cloud databases have been running. These numbers are used in billing for the cloud services that are consumed.
For non-metered cloud accounts, this metric also lists your Database instance quota and how much of it you have used. The quota is utilized when you provision a Cloud database (see Create a Service Instance) and released when you delete a Cloud database (see Delete a Service Instance).
Alert Rules are the ability to get an email when the quota has reached a particular number.
-
Business Metrics
This is your service usage metric. You can customize the graphs on this page. The metrics provided on this page include:
-
Object Count – This is the number of objects in the PDB.
-
Table Count – This is the number of tables in the PDB.
-
Storage Used (GB) – This is the amount in GB of storage that is in use.
-
Storage Percent (%) – This is the percentage of the storage limit that is in use.
-
Storage Limit (GB) – This is the total amount of storage allocated for this PDB. Because there is some storage overhead required to create the PDB, you are given more storage than the amount you purchased.
-
-
Documents
This option is not available at this time.
-
Status
This is the up time of your service including planned outages.
Related Topics