Monitor and Adjust Processes

Use these options to monitor overall process flow and make adjustments as needed.

View Alerts

If you’re an administrator, your Home page displays alerts with the number of suspended and recoverable instances, and alerted tasks. Click an alert to view details about the problematic instances or tasks. Select an instance or task and correct the problem.

Track Process Instances

Tracking a process instance enables you to identify any problems with the flow or the assignment that might be delaying the process. Depending on your role, you can locate and track the flow of a specific instance, and view the instance history, comments, attachments, details, and documents.

Users assigned the Process Owner and Process Reviewer roles can track the entire process. Want to learn more about these roles? See Assign and Manage Roles.

To track process instances:

  1. In the Oracle Integration navigation pane, click My Tasks, click Workspace, and then click Processes.
  2. Click the instance you want to track.
  3. In the Instance Details pane, view the following:
    • Open Activities: displays the currently running activities in the process. At a certain point in the flow, the process might have multiple activities running at the same time.
    • Comments: displays the history of the comments for this process instance.
    • Attachments: displays the attachments for this process instance.
    • History: enables you to view the process flow this instance followed before getting to the current activity. You can view the history as a list, a tree, or a graphic.
    • Details: displays detailed information about the instance such as the priority, the status and the creation date.
    • Documents: displays the documents that are integral to the instance.
You can change the process flow of an instance that is currently suspended because of a problem, or move an instance that is running to another activity. You can also modify values that are causing an activity to fail and then retry running the current activity again. See Altering the Flow of a Process Instance.

Alter the Flow of a Process Instance

You can change the process flow of an instance that is currently suspended because of a problem, or move an instance that is running to another activity because of a specific reason. If an activity is failing because of the value of the data objects and instance attributes, then you can modify them and retry running the current activity again.

To alter the flow of a process instance:
  1. In the Oracle Integration navigation pane, click My Tasks, click Workspace, and then click Processes.
    Alternatively, you can access suspended instances, recoverable instances, and alerted tasks from the alerts box on the home page. See Viewing Alerts.
  2. Click the instance you want to alter.
  3. In the Instance Details pane, click Alter Flow & action.
    • If the status of the selected instance is In Progress, then the button is labeled Alter Flow & Suspend.

    • If the status of the selected instance is Suspended, then the button is labeled Alter Flow & Resume.

  4. In the Open Activities table, go to the New Activity column and select an activity that redirects the process instance.
  5. In the Comments field, enter a comment justifying your action or adding information.
  6. Optionally, you can change the value of the data objects or instance attributes:
    1. To view the process instance attributes, click Show Instance Attributes.
    2. To display the data object in a tree, click Show as Tree located below the Data Objects list.
    3. Click the data object whose value you want to modify.
      The XML that represents that data object appears to the right of the list of data objects.
    4. Locate the value of the data object in the XML and edit it.
  7. Click either Resume or Suspend. Depending on the current status of the process instance only one of these buttons appears.
The process instance moves to the selected activity. Suspended instances are resumed, and running instances are suspended.

Monitor Key Metrics in Dashboards

Use the dashboards to monitor the overall state of your processes and view specific process metrics such as bottleneck processes. You can also create custom graphs to view process data based on the business indicators defined in your business processes.

To monitor dashboards:

  1. In the Oracle Integration navigation pane, click My Tasks, click Workspace, and then click Dashboards.
  2. On the Process Monitoring tab, select each dashboard to view information about your processes.

    The available dashboards are:

    Dashboard Description
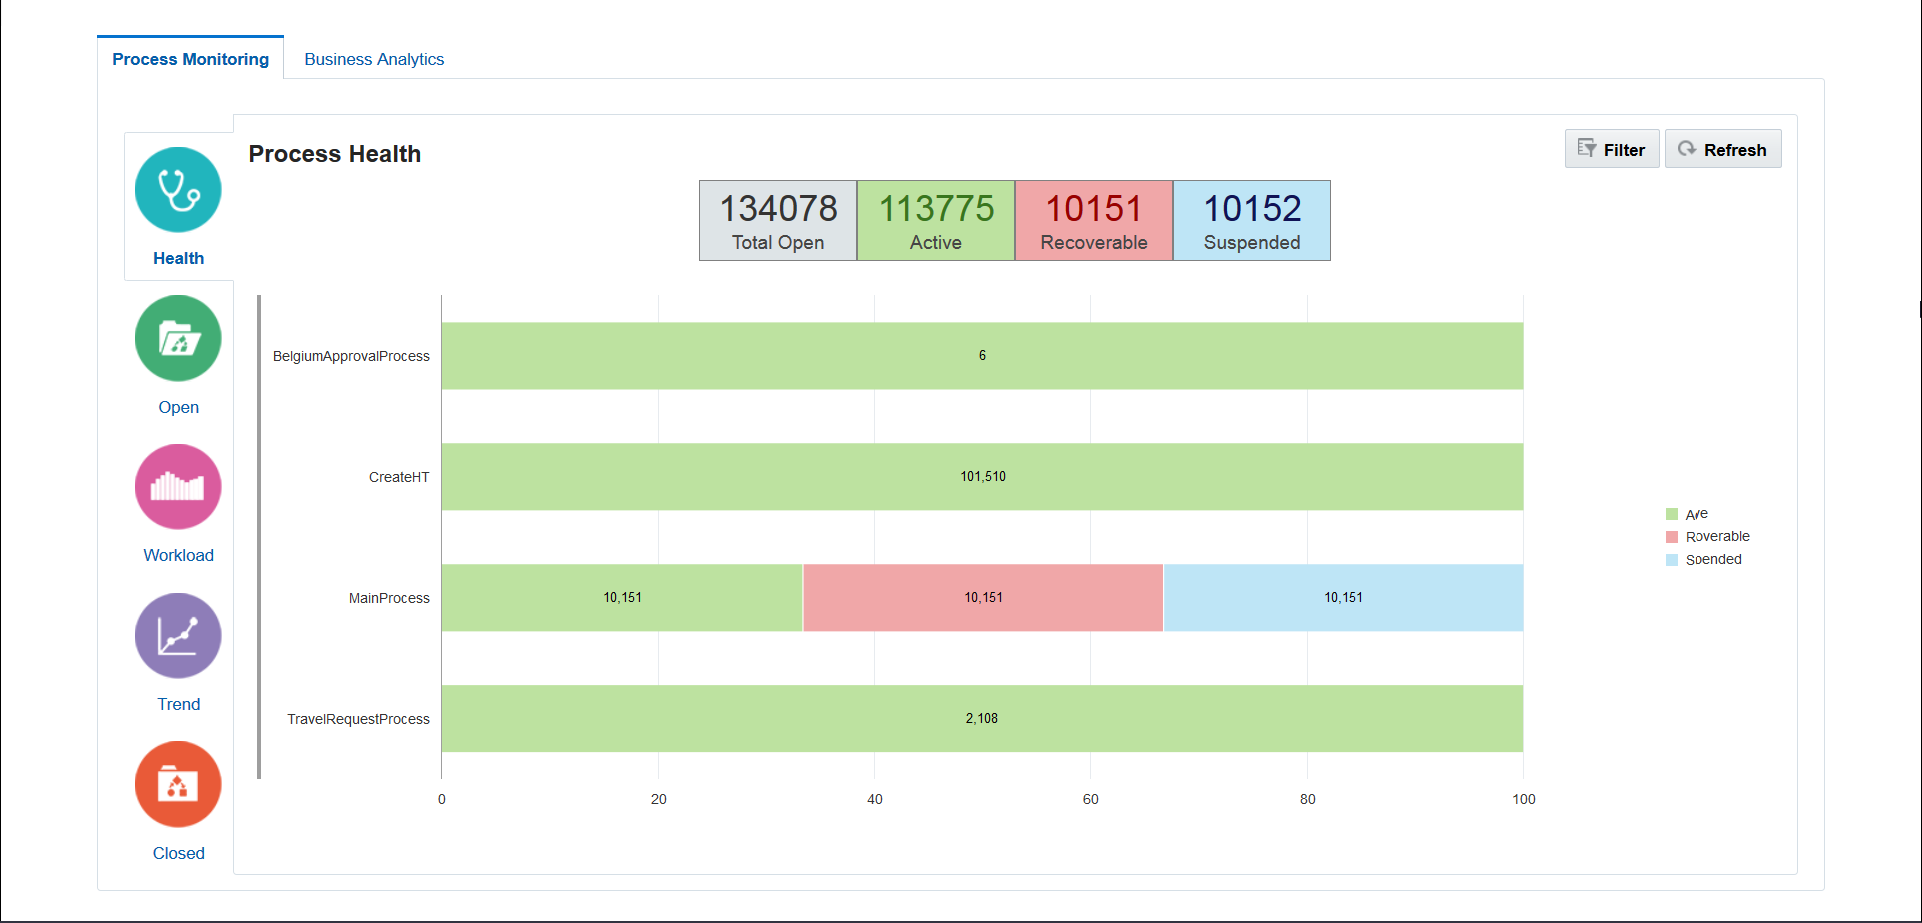
    Health

    Monitor the overall state of the processes available to you, and spot any anomalies.

    Shows the total number of instances that are in progress, suspended, and recoverable for each process. Click Total Open, Active, Recoverable, or Suspended to view the instances for the selected item or double-click a line in the chart to view the instances for that process.

    Open

    Shows a top level view of the current running instances, and a detailed analysis of the running instances for each process. This analysis includes the number of instances on track, due this week, overdue, suspended, recoverable, created today and closed today. Click any of the rows to view the instances for that process.

    Workload

    Shows the workload for the top ten processes or bottleneck processes. View the workload for each of the processes by task or by assignee.

    Trend

    View the workload and cycle trend for each process, or the workload and cycle trend for each of the tasks in those processes.

    Closed

    View the closed instances for the current day, week, or month, that are successfully completed, aborted, and errored. Also see the average cycle time for the current period, the previous period, and the maximum cycle time for the current period.

    You can click Filter at any time to select specific processes to view for that dashboard.

    These filters enable you to select which processes to display. For some types of dashboards, you can also select the assignees and time period to display.

Create and View Business Analytics Dashboards

Use the Business Data Query to plot and view charts and graphs for application metrics and create Business Analytics Dashboards. You can create charts that display business indicator values (metrics specific to a process) and system indicator values (metrics automatically captured).

When designing a process, developers create business indicators for data objects whose metrics they want to capture and display as X axis, Y axis, and filter values. You select the business or system indicators to plot them in charts and graphs. Users can create business analytics reports if they have the Process Owner role, the Administrator role, or the Analytics Viewer role on the corresponding application on which the report is being generated. Business analytics reports created by one user cannot be shared with other users even if they belong to the same role. See Assign and Manage Roles.

To create and view business analytics charts and graphs:
  1. In the Oracle Integration navigation pane, click My Tasks, click Workspace, and then click Dashboards.
  2. Click the Business Analytics tab.
    If you’re creating a query for the first time, click Get Started.
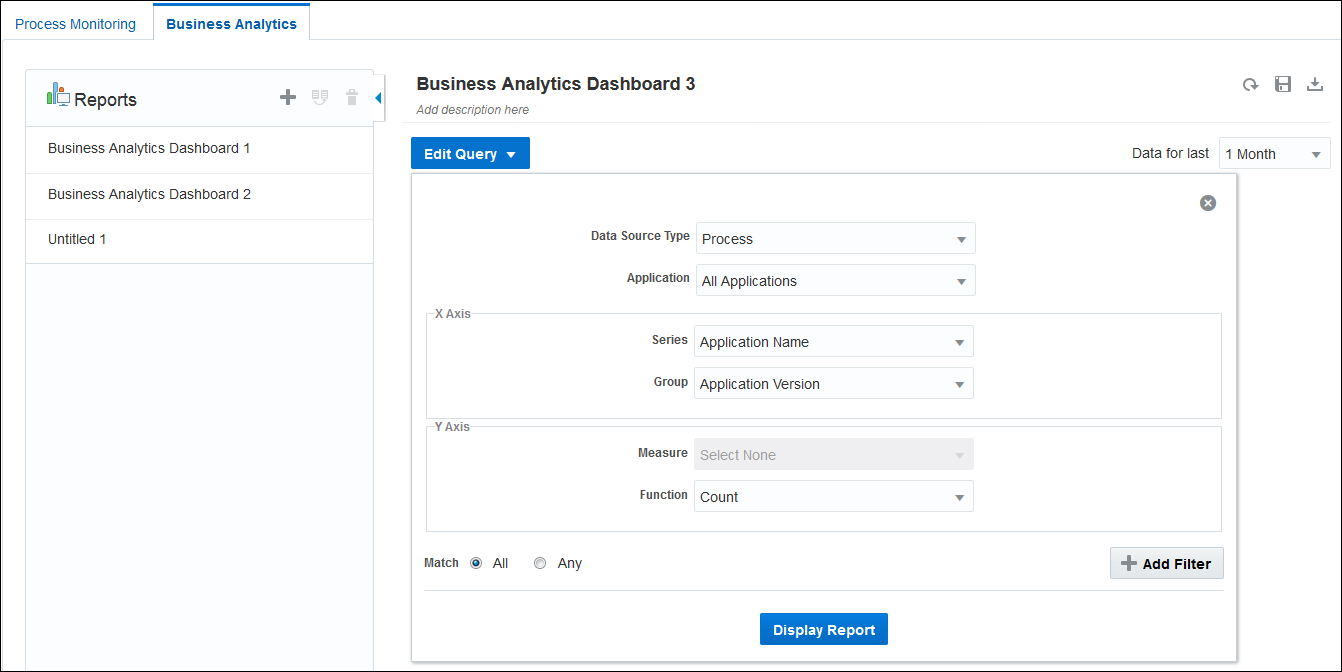
  3. In the Reports pane, click New Query New Query icon.
  4. Enter a name in the Untitled field.
    You can also add a description for the new query in the Add description field.
  5. In the Data Source Type field, select a source for the chart or graph.
    Typically, this value is left as Process, the default value.
  6. In the Application field, select the application to report on.
    You can select All Applications to report across multiple active applications, using system indicators only.
  7. In the X Axis options, scroll the Series and Group fields to see available indicators, and select dimension indicators to plot for the chart’s X axis.

    Business indicators are listed first, followed by standard system indicators. Want to learn more about dimension indicators? See Add Dimension Business Indicators. You must specify both a series and a group indicator for the X axis.

    Note:

    If you select the Date data type indicator for the X axis, then you can use the Time Grouping option to specify the time frame for the business analytics dashboards of the application. For example, in case of a Travel Request Application, if you select Year, you can view the number of Travel Requests by the year.
  8. In the Y Axis fields, scroll the Measure field to see available indicators, and select a measure indicator and standard function to plot for the Y axis.
  9. Optionally, add one or more filters. Click Add Filter. From the fields that display, click the left one to see available indicators, and select an indicator by which to filter. For available system indicators, see Select System Indicators.
    Want to learn more about attributes? See Add Attribute Business Indicators.
  10. Click Display Report.

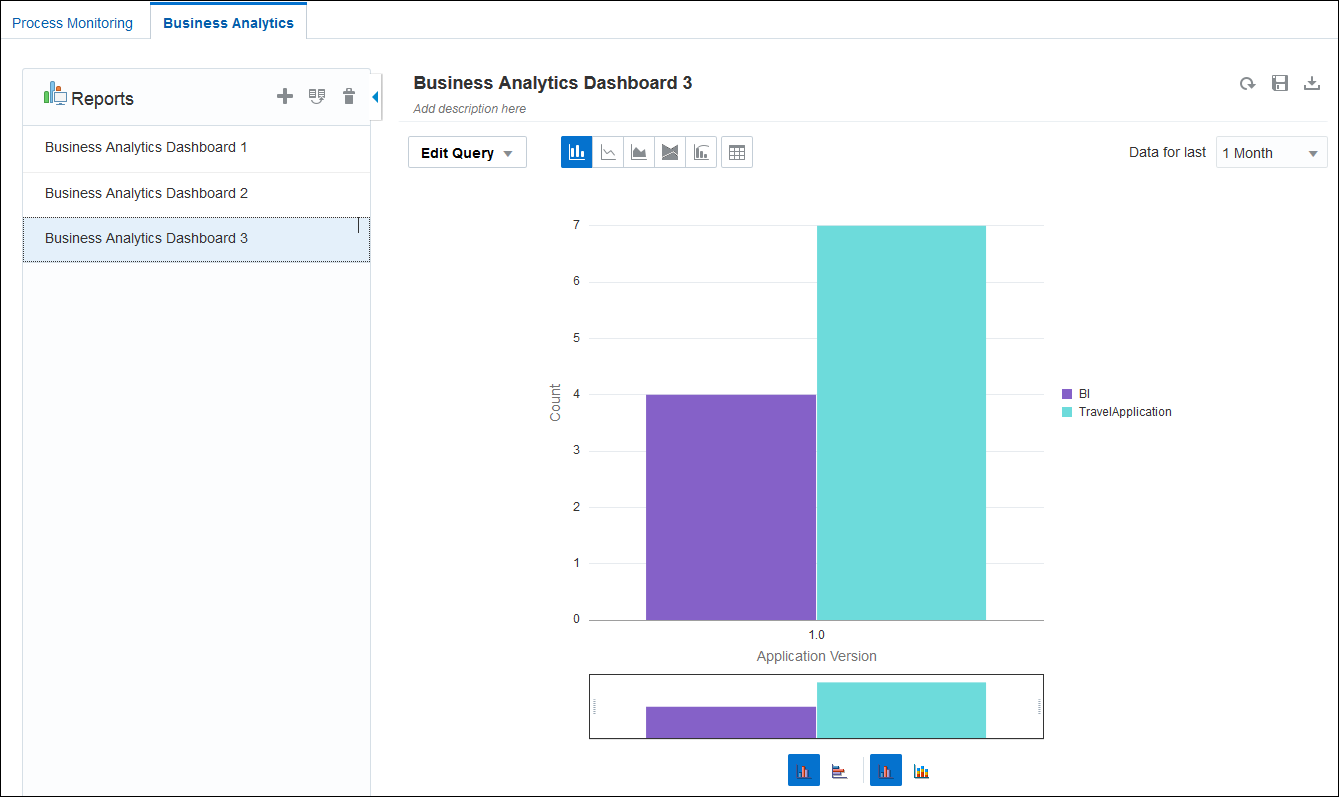
    The chart is plotted and displayed on the right side of the page.

    Description of edit-query.png follows
    Description of the illustration edit-query.png

  11. Click Save to save the business analytics dashboard that you just created.
    After you save the query, you can select and view it on the Reports pane.

    Note:

    You can use the Collapse button to hide the Reports pane when not in use.

    Description of business-analytics-dashboards.png follows
    Description of the illustration business-analytics-dashboards.png

  12. Optionally, change the chart or graph’s display.
    1. Use the Data for last drop down list to select the duration of the activity. By default, the data for last 1 month is selected.
    2. Use the icons in the top and bottom to change the chart’s type and orientation and stack.
  13. You can Delete or Copy the Business Analytics dashboard or Reset the fields for X axis and Y Axis and create a new graph.
  14. Optionally, export the data to a file, click Download CSV, and open or save the export.csv file.

Note:

Editing a dashboard’s query and saving it results in overwriting of the selected dashboard or report. If you want to retain a previously generated dashboard and also create a new one with modifications to the earlier query, use Copy Query Copy Query.

Select System Indicators

You can select the system indicators when you add filters to create business analytics charts and graphs.

The following are the valid filter values for some of the system indicator columns:

  1. Is Recoverable

    • Y: Represents Yes

    • N: Represents No

  2. All other system indicator colums starting with "Is ..."

    • 0: Represents false

    • 1: Represents true

  3. Due Status

    • DUE SOON

    • MISSED DUE

    • ON TRACK

    • OVERDUE

  4. Process Activation Status

    • -1: refers to un-activated status

    • 0: refers to retired status

    • 1: refers to activated status

  5. Process Instance Status

    • ABORTED

    • ACTIVE

    • COMPLETED

    • FAULTED

    • SUSPENDED

  6. Activity Instance Status

    • ABORTED

    • ACTIVE

    • COMPLETED

    • FAULTED

    • MOVED

    • SUSPENDED

  7. Assignment state

    • ACQUIRED

    • ASSIGNED

    • COMPLETED

    • ERRORED

    • EXPIRED

    • DELETED

    • WITHDRAWN

    • SUSPENDED

  8. Task State

    • ALERTED

    • ASSIGNED

    • COMPLETED

    • ERRORED

    • EXPIRED

    • DELETED

    • INFO_REQUESTED

    • WITHDRAWN

    • SUSPENDED

View and Resend Email Notifications

You can view the notification logs to monitor the status of notifications sent for tasks and Business Activity Monitoring. You can try to resend the email notifications to all the original recipients or to some of them by using the notification logs if the email notifications fail due to lack of network availability, wrong email addresses, or temporarily unavailable email servers. By default, a resend is automatically attempted for all failed notifications after an interval of fifteen minutes.
To view the notification logs:
  1. In the Integration Cloud navigation pane, click My Tasks, click Workspace, and then click Administration.
  2. Click Notification Logs.
    The Notifications table displays the following information:
    • Process

    • Source

    • Recipients

    • Sent On

    • Status

    • Actions

  3. On the Notification Logs page, you can:
    • Search for a specific notification.

    • Sort the notifications by date or by status.

    • View bad addresses.

      Click the View Bad Addresses button. A dialog box with the list of emails with bad email addresses opens.

    • Test notifications.

      Click the Test Notifications button. A dialog box opens for you to send a notification email as a test.

    • Fix notification problems.

      Click the drop-down list on the actions column and select one of the following actions:
      • Resend to all members

      • Resend to specific members

      • Delete