Edit Explorations

After you create an exploration, you can edit it using the Exploration Editor. You have the option to edit the parameters of the exploration, add or modify the data sources for the exploration, and publish the exploration.

To edit an exploration:
  1. Navigate to the Data and Explorations page for your IoT Application.
  2. Go to the Explorations section, select the exploration you want to edit, and click View.
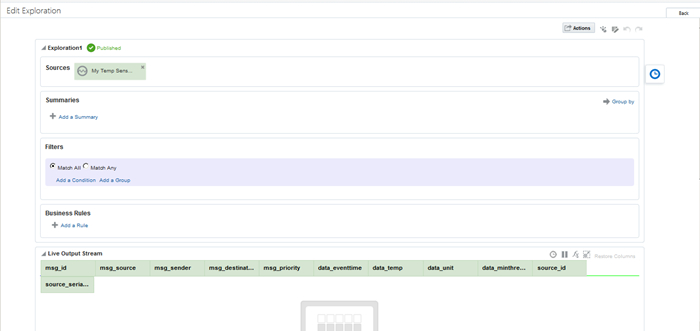
    The Exploration Editor is displayed, as illustrated below: Description of exploration-editor.jpg follows
    Description of the illustration exploration-editor.jpg
  3. Click the Actions menu located at the top right corner of the Exploration Editor and choose Publish, Unpublish, or Discard.
  4. Click the Show Topology icon to view the topology. For more information, see Topology Viewer.
  5. Click the pencil icon at the top-right corner to view the information of the exploration.
    1. Click Edit Info to update Name, Description, or Tags of the exploration.
    2. Click Done after updating the information.
  6. Click Undo Changes icon at the top-right corner to undo the changes you have made. Click Redo Changes icon at the top-right corner to re-apply the changes you have made.
  7. Click anywhere in the Sources field to add or remove data sources. If you have more than one data source, the sources must be correlated
  8. Define the Correlations if the exploration has more than one data source.
  9. Click Add a Summary in the Summaries area to add a summary to the exploration.
  10. Click Add a Condition or Add a Group in the Filters area to add filters to the output. Choose Match All or Match Any to define how the filters should be applied. The filters further refine the streaming data based on the conditions you’ve added.
  11. Click Add Rule in the Business Rules area to add business rules to the exploration. Business rules build conditional logic into your applications. See Business Rules.
  12. Use the Live Output Stream to view the data stream that meets the exploration’s criteria.
    1. Click Timestamp to display the timestamp in the Live Output Stream. The timestamp at which the streaming data was captured appears against each row of live output stream. This is a toggle button and you can use it to switch ON or OFF the timestamp in the live data.
    2. Pause the live data that is streaming using the Pause icon and resume the stream using the Resume icon.
    3. Click Restore Columns to restore any of the columns that you have hidden earlier.
    4. Click Detach to detach the Live Output Stream into a separate window. You can attach it later again.
    5. Manage the header of any columns by clicking the header and renaming the columns. You can also click and drag any of the columns in the Live Output Stream to reorder the columns. Resize the columns using the mouse. You can also hide or reveal the columns.
    6. Add expressions or functions to the live output stream to calculate certain data based on the data that is streaming. Use the Expression Editor to add a function or expression. Click the expression editor and enter = followed by the required function in the Enter your expression field. Click the Done icon to finish adding the expressions and save the added expressions or functions. Click Cancel to abort the operation at any time. For more information, see Expression Builder.
  13. Configure the number of graphs you want to be displayed for the output stream in the Charts area.
  14. Click Publish.