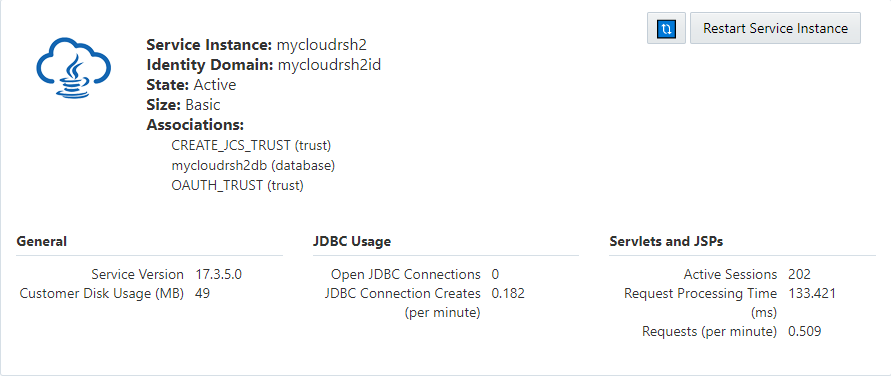
Viewing Basic Service Information on the Home Page
When you open the JCS - SaaS Extension Administration Console, the first page you see is the Home page, which shows general information about your service instance.
This page displays basic information about a service along with usage metrics for a single JCS - SaaS Extension. All metrics represent the most recent values available. The page also contain the Restart Service Instance button.
Service Identification Information
-
Service instance name
-
Identity domain
-
State
-
Size
-
Associations
General Information
-
Service Version; the version number of the running JCS-SaaS Extension.
-
Customer Disk Usage; the amount of disk space, in megabytes, the customer has consumed.
JDBC Usage
-
Open JDBC Connections; Number of JDBC (Java Database Connectivity) connections currently in use
-
JDBC Connection Creates (per minute); Number of database connections created per minute in the last five minutes
Servlets and JSPs
-
Active Sessions; Number of active sessions
-
Request Processing Time (ms); Average number of servlet or JSP (Java Service Pages) invocations per minute in the last five minutes
-
Requests (per minute); Time spent processing request
Restart Service Instance
This page also contains the Restart Service Instance function. If the JCS - SaaS Extension instance somehow reaches an inconsistent state, for example, due to a network error, you can use the Restart Service option to restart the service, which will restart all the managed nodes in the service's domain.
