Before you Begin
Oracle Log Analytics is a highly scalable, reliable, and real-time log analysis solution. Log Analytics automates the collection of historic and real-time logs from any on-premises or cloud resource. The service offers multiple methods to ingest the logs into OCI before you start analyzing them.
This guide walks you through the steps to set up continuous log collection in Log Analytics. In about 30 minutes you'll set up Log Analytics, install agents, ingest some important Linux host logs, and explore the logs in our Log Explorer.
Background
In this example, a management agent will be installed on a Linux host from where we want to continuously collect logs. Agents are typically installed in your on-premises data center, but you can also install them on a cloud compute instance that is running Linux. Note that this tutorial focuses on using the standalone Management Agents for log collection.
Learn about the key resources in Log Analytics and their hierarchy. See Hierarchy of Key Resources.
What Do You Need?
- An OCI user account. This user will be added to the Logging-Analytics-SuperAdmins group.
To enable Oracle Log Analytics, the user must be a member of the Administrators group. Also, when using Add Data wizard, the user must be a member of the Administrators group with access to root compartment to ingest logs for monitoring OCI resources, monitoring with management agent (only if you must also configure the management agent), monitoring Kubernetes, or for Security and Compliance. See The Administrators Group, Policy, and Administrator Roles.
- A Linux host to install the Management Agent on and to collect the logs from.
- If your host is an OCI Compute Instance, then you can enable the Management Agent plugin in the Oracle Cloud Agent. See Deploy Management Agents on Compute Instances. If you want to enable Management Agent plugin in the Oracle Cloud Agent, then ensure that the JVM heap size is at least 512 MB. However, note that, if required, you can also use a standalone agent on an OCI Compute Instance.
If your host is a non-OCI Compute Instance, then install the Management Agent as described in the section Install Management Agent.
- Identify a log sources suitable for your use case. You will associate the sources to the entities that you create in the later section. Note that you will also have to identify the parsers to be included in the source. You can select from a large set of Oracle-defined sources and parsers, depending on your requirement. See Log Analytics Terms and Concepts: Source and Oracle-Defined Sources.
Enable Log Analytics
If you are already using Log Analytics, then verify that the service policies and user / group policies are created. Open the navigation menu and click Identity & Security. Under Identity, click Policies and verify. For the list of policies created, see Policies Created While Onboarding Log Analytics. Skip this section and proceed to the section Install Management Agent.
If you are a new user and want to start using Log Analytics, then follow the below onboarding process.
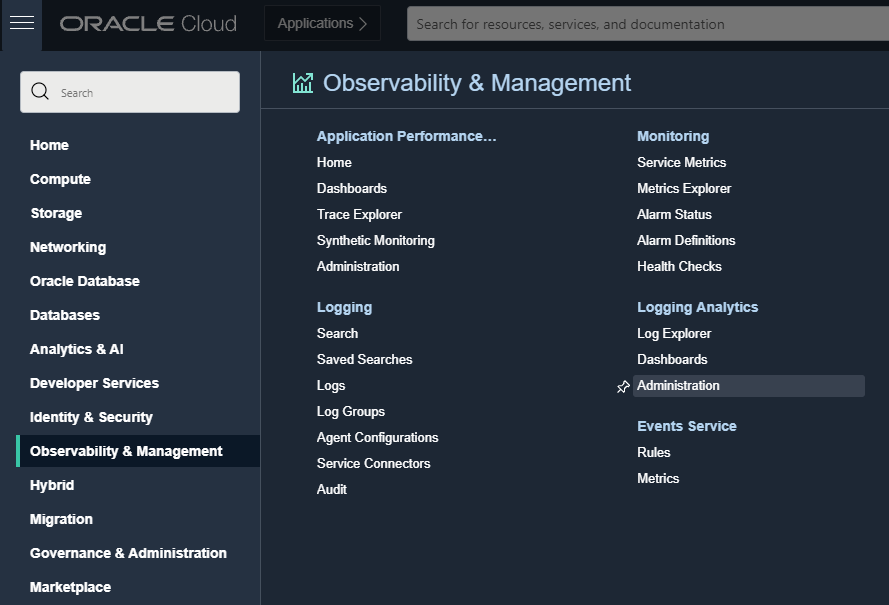
- Log Analytics is available from the top level OCI console menu. Navigate to Observability & Management and click Log Analytics.
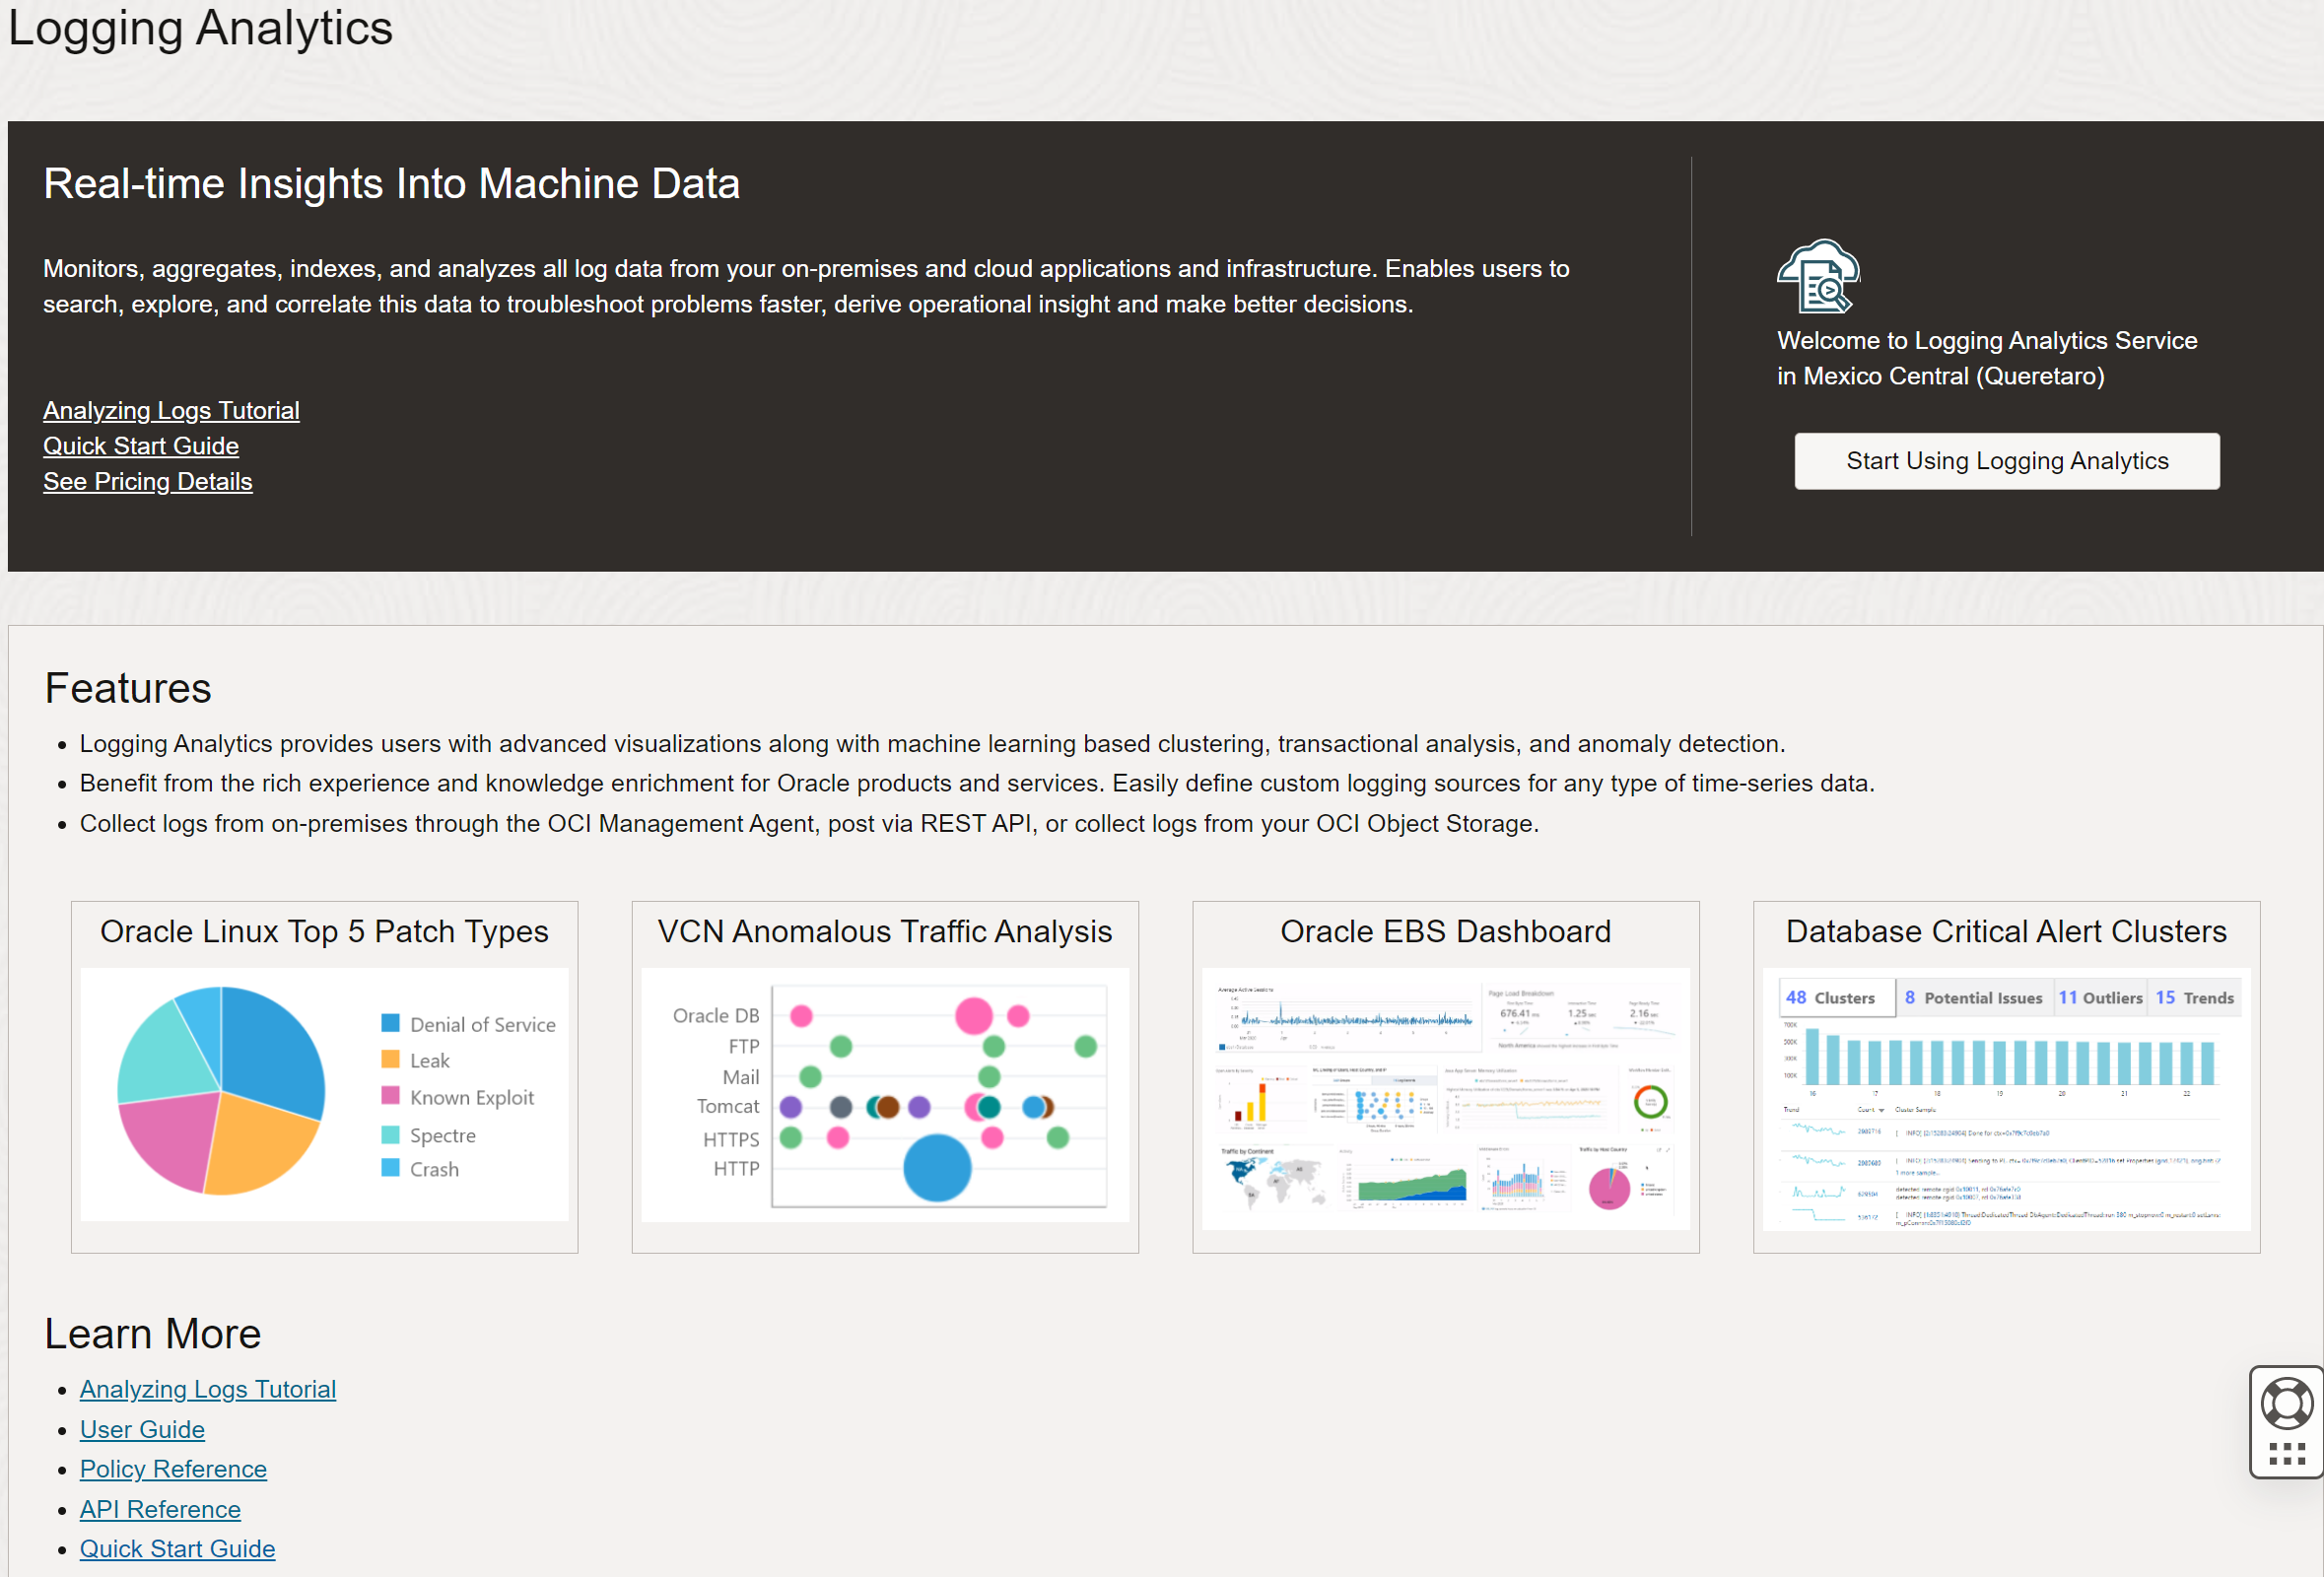
Description of the illustration ela1 - Review the on-boarding page that will give you some high level details of the service and an option to start using Log Analytics service. Click Start Using Log Analytics.
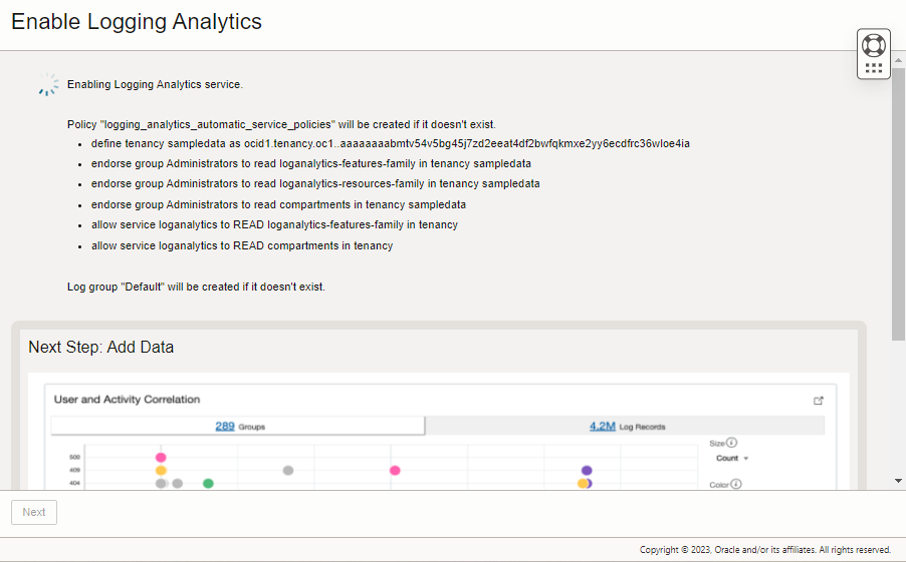
Description of the illustration ela2 - Review the policies that are automatically created. For the list of policies created, see Policies Created While Onboarding Log Analytics. The log group Default is created if it does not already exist. After Log Analytics is enabled successfully, click Next to continue.
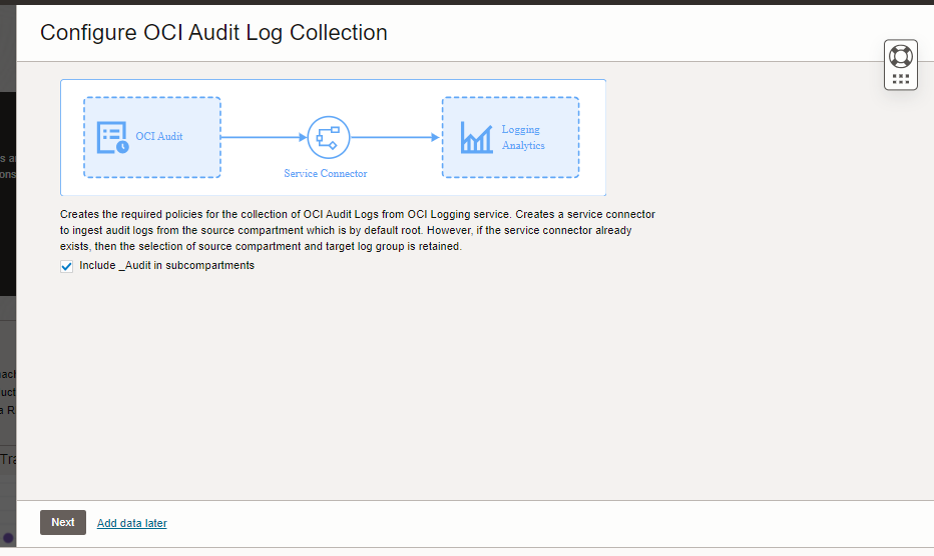
Description of the illustration ela3 - The OCI Audit Logs collection is configured. The check box Include _Audit in subcompartments is enabled by default. For the list of policies created to configure OCI Audit logs collection, see Policies Created While Onboarding Log Analytics. Click Next.
Description of the illustration ela4 - After the OCI Audit Logs Analysis is enabled successfully, click Go to OCI Audit Logs Dashboard and view the analysis.
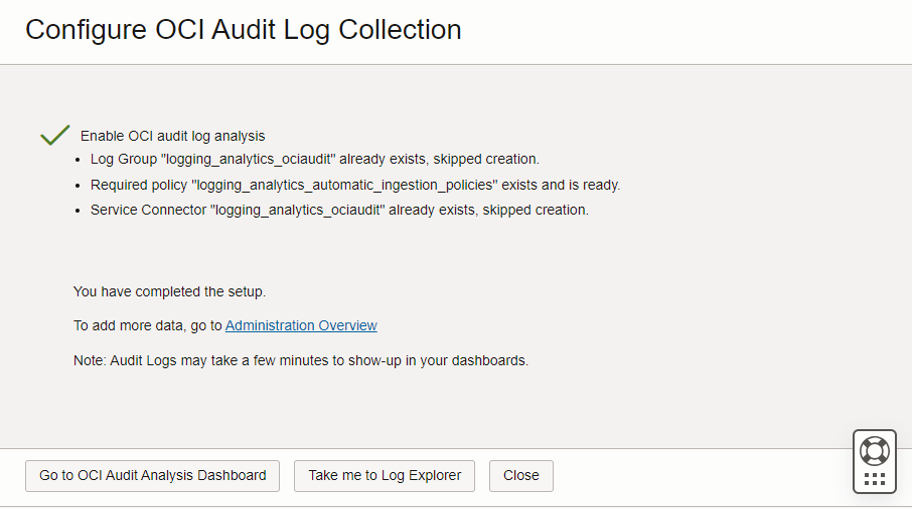
Description of the illustration ela6
Use Management Agent
Select one of the following two ways of using a management agent to set up continuous log collection:
Use Oracle Cloud Agent on an OCI Compute Instance
If you want to use Oracle Cloud Agent for log collection, then ensure that the compartment of the dynamic group logging_analytics_agent matches the compartment that Oracle Cloud Agent is installed in. Also, ensure that the JVM heap size is at least 512 MB.
For steps to deploy the agent, see Deploy Agent on OCI Compute Instance.
Manually Install Standalone Management Agent
- Go to the Administration Overview page. In Log Analyticsnavigation menu, click Administration, and select Overview. The Administration Overview page opens.
- Click Add data. The Add Data page opens. Expand the section Monitor with management agent.
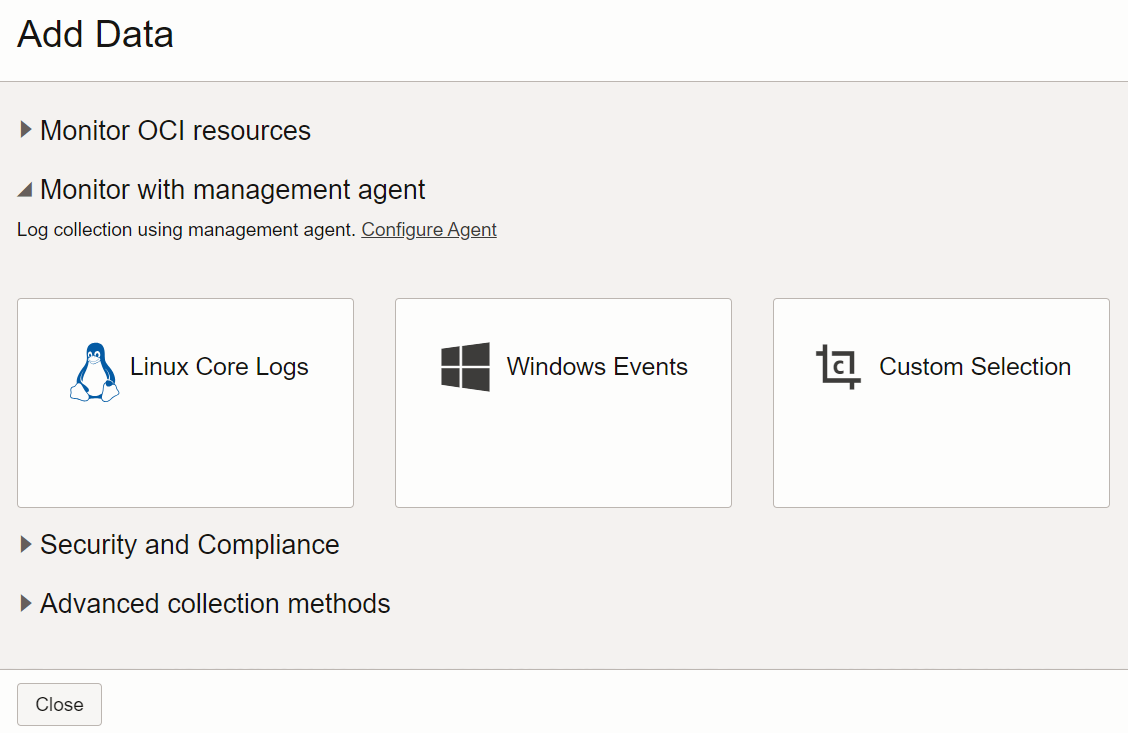
Description of the illustration sui2 - Click the Configure Agent link. The section expands with more information about management agent based log collection.
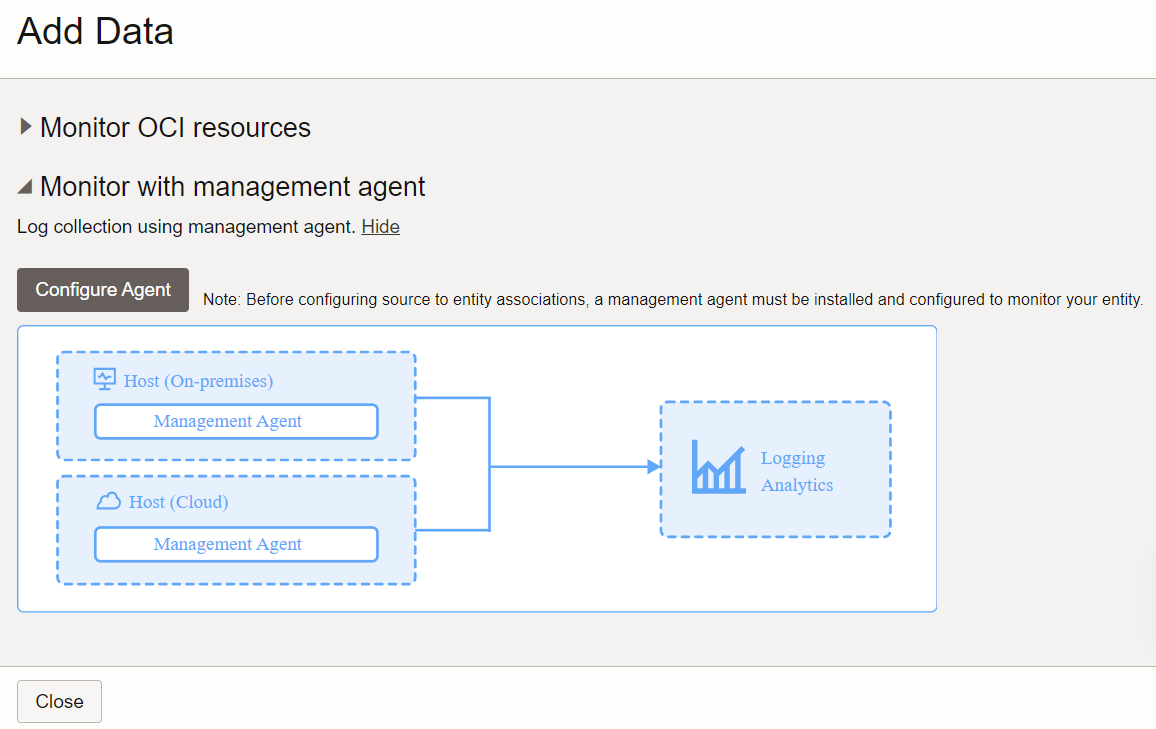
Description of the illustration sui3 - Click the button Configure Agent. The Set Up Ingestion dialog box opens.
- Review the policy that is automatically created with the listed policy statements. Note the resources that are automatically created. Click Set Up Ingestion.

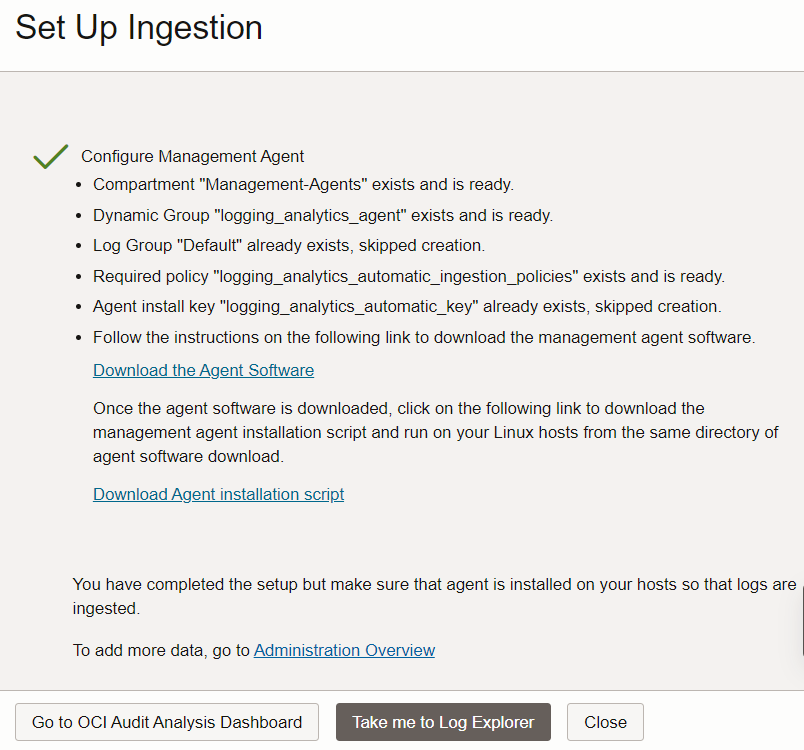
Description of the illustration sui4 - Follow the Download the Agent Software link to download the management agent software. After you complete the download, follow the Download Agent Installation Script link to get the installation script. Run the installation script on your Linux host in the same directory where the management agent is downloaded. For detailed instructions to install the management agent, see Install Management Agents.
Description of the illustration sui5 Ensure to deploy the Log Analytics plug-in when installing the agent. As part of the installation process, you will need to create a response file in which you must include the following line about enabling Log Analytics plug-in:
Service.plugin.logan.download=true
- After the Management Agent is configured successfully, click Close.
Prepare Your Host to Transmit Logs to Log Analytics
Note:
On Unix-based hosts, the user that installs management agent is mgmt_agent for the manually installed management agent, and oracle-cloud-agent when the management agent is a plugin enabled with Oracle Cloud Agent. For more information about the Oracle Cloud Agent, see Oracle Cloud Agent.Ensure that the log files are readable by the agent user.
If your log file is located at
/a/b/c/file.log, then you must verify the read permission for the log filefile.logas well as the foldersa,b, andcin the file path.
For example:
sudo -u <agentuser> /bin/bash -c "ls /a"
sudo -u <agentuser> /bin/bash -c "ls /a/b"
sudo -u <agentuser> /bin/bash -c "ls /a/b/c"
sudo -u <agentuser> /bin/bash -c "tail /a/b/c/file.log"
If the agent user cannot read the log files, then use one of the following ways (in the order of best practice) to make the log files readable to the management agent. It is recommended that you try each method in the order listed, and check if the access is available before trying the next one.
-
Use Access Control Lists (ACLs) to enable the agent user to read the log file path and log files. An ACL provides a flexible permission mechanism for file systems. Ensure that the full path to the log files is readable through the ACL.
To set up an ACL in a UNIX-based host:
Determine whether the system that contains the log files has the acl package:
rpm -q acl
If the system contains the
aclpackage, then the previous command should return:acl-2.2.39-8.el5
If the system doesn’t have the
aclpackage, then download and install the package. Run the following
setfaclcommands:First, check for the existing permissions and add to them, if necessary. Make sure that the changes do not impact the existing ones.
- Grant the agent user READ access to the required log file:
setfacl -m u:<agentuser>:r <path to the log file/log file name>
- Set Read and Execute permissions on folders other than parent folder:
setfacl -m u:<agentuser>:rx <path to the folder>
- Set Read and Execute permissions with recursive options on parent folder:
setfacl -R -m u:<agentuser>:rx <path to the folder>
- Set Read and Execute with default option to allow all future log files created under this folder to be readable.:
setfacl -d -m u:<agentuser>:rx <path to the folder>
For example, the following commands are needed for the path
/scratch/logs/*.logfor the management agent usermgmt_agent:setfacl -m u:mgmt_agent:rx /scratch setfacl -R -m u:mgmt_agent:rx /scratch/logs setfacl -d -m u:mgmt_agent:rx /scratch/logs
- Grant the agent user READ access to the required log file:
Place the management agent and the product that generates the logs in the same user group, and make the files readable to the entire group. Restart the agent.
For nfs mount, it may not be possible to give READ and EXECUTE permission to the agent user to read the log files or folders. In such cases, add the agent user to the log file group by running the bellow command, and restart the management agent:
usermod -a -G <group of log file> <agentuser>
Make the log files readable to all users. For example:
chmod o+r <file>
You may have to give executable permission to the parent folders. For example:
chmod o+rx <parent folder>
-
- Verify that the agent is communicating with Oracle Cloud.
- From the OCI console menu, navigate to Observability & Management, and click Management Agent.
- Ensure you are in the Management-Agents compartment using the selector on the left side of the screen.
- Click the Agents menu. You can see your recently installed agent, the host it is installed on, and the Log Analytics plug-in that you installed. Verify that the Availability of the agent is Active. See Verify the Management Agent Installation.
- View the Service Metrics of the agent in Monitoring, and ensure that there are no errors and the data flow is satisfactory. See Management Agent Metrics: Using the Console.
Map Your Host to an Entity in Log Analytics
To enable continuous collection through the agent, entities that represent the on-premises or cloud assets must be present in Log Analytics. When the management agent is installed, the entities for the log-emitting host and the management agent are automatically created. Verify that the entities are present in your Log Analytics environment. If the required entities are not present, then create them.
When creating the entity, select Management-Agents as the management agent compartment and select the agent that you installed earlier. When you followed the steps for onboarding or to set up ingestion, the wizard automatically created this compartment and located the agent in it.
- From the OCI Console Menu, navigate to Observability & Management. Under Log Analytics, click Administration.
- The administration resources are listed in the left hand navigation pane under Administration. Click Entities. The Entities page opens.
- Select the compartment for the new entity in the search bar.
- In the Entities listing page, click Create Entity.
- Select Host (Linux) as the entity type. You can start typing the name to filter from the drop-down list.
- Provide a name for the entity. In this example we will use
host123, but you normally would use the actual host name. - Select Management-Agents as the Management Agent compartment.
- Select the agent that you installed earlier.
- Click Create.
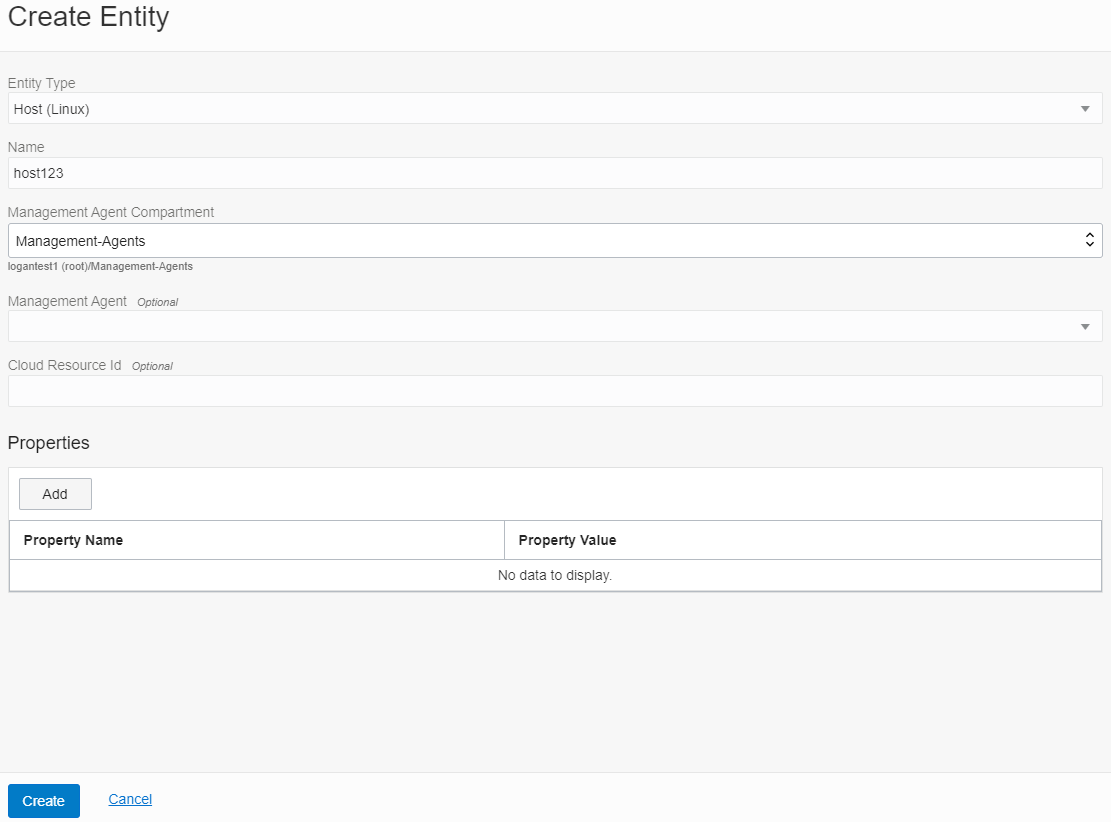
Description of the illustration myh9
Create Associations Between Entities and Sources
A user of Log Analytics associates a log source to an entity to initiate the continuous log collection process through the OCI Management Agents. The concept of source-entity association only applies to continuous log collection through the agent. In this section, the steps help you to perform source-entity associations using the Add Data wizard.
- Go to Administration Overview page. Click Add Data.
The Add Data wizard opens.
- Under Monitor with management agent, click Custom Selection.
Note that, for the logs of Host(Linux) entity type, you can also click Linux Core Logs to get a refined list of entities of the specific type, and also the eligible sources. However, for the purpose of experiencing the full functionality of the wizard, we shall select Custom Selection.
Description of the illustration sui2 In the resulting Configure Agent-based Log Collection page, all the configured entities are listed.
- Filter from the list of entities by specifying the entity type. Select Specify Entity Types. From the menu, select Host(Linux) entity type.
- From the list of entities of the type Host(Linux), select up to 50 entities to configure association with the sources. Click Next.
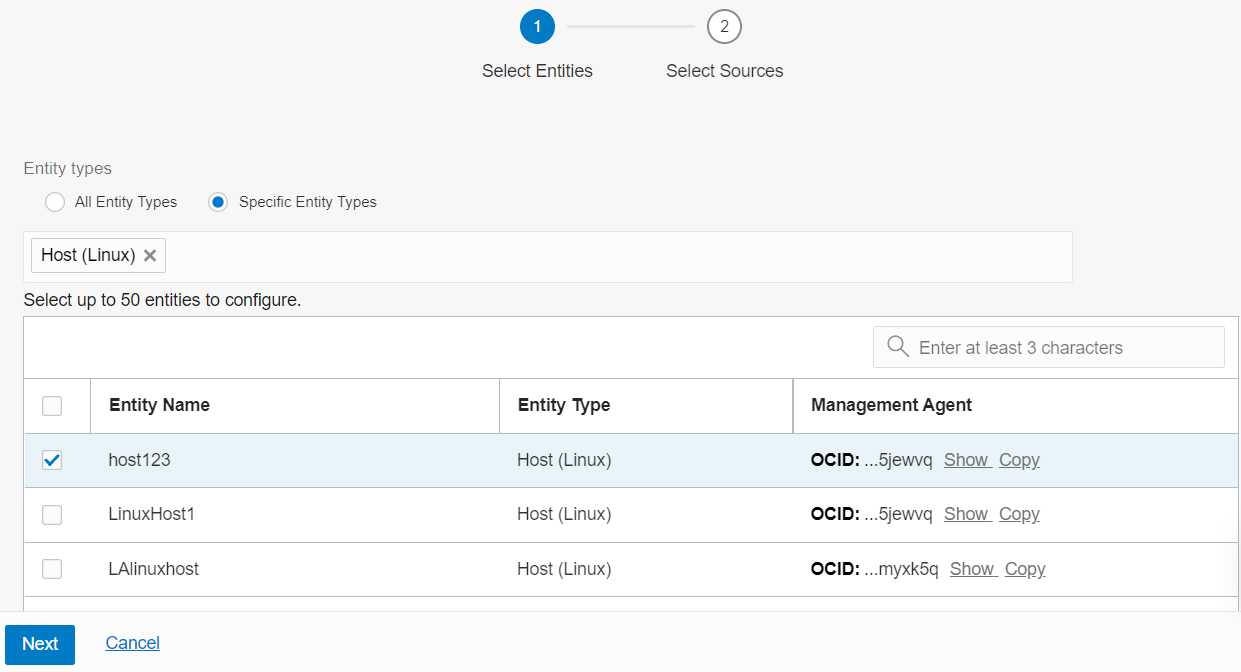
Description of the illustration ca4 - From the table, select up to 25 sources to associate with the selected entities.
Description of the illustration ca7 - Click Show Agent Collection Properties to expand the section. The agent properties that you specify here will apply for all the source-entity associations added in this workflow. Based on your previous selections, the Source Type is already populated. The agent properties for that source type are listed in the table.

Description of the illustration ca9
- Hover the cursor on the info icon to know what the default value is.
- In the New Value field, enter the new value for the property that you want to modify. Ensure that the data type of the value is as specified. For the list of properties you can modify for each source type, and their corresponding data types, see Advanced Configuration Options for Management Agent: Modify Agent Properties.
- To change the property to the default value, click Actions menu icon and select Reset to default.
- To clear the current value of the property, click Actions menu icon and select Clear current value. If you clear the current value, then the new value is inherited. The new value is displayed in the table after you save the current changes and reopen this dialog box.
To understand the various levels of hierarchy for setting agent properties and the inheritance rules for their values, see Advanced Configuration Options for Management Agent: Modify Agent Properties.
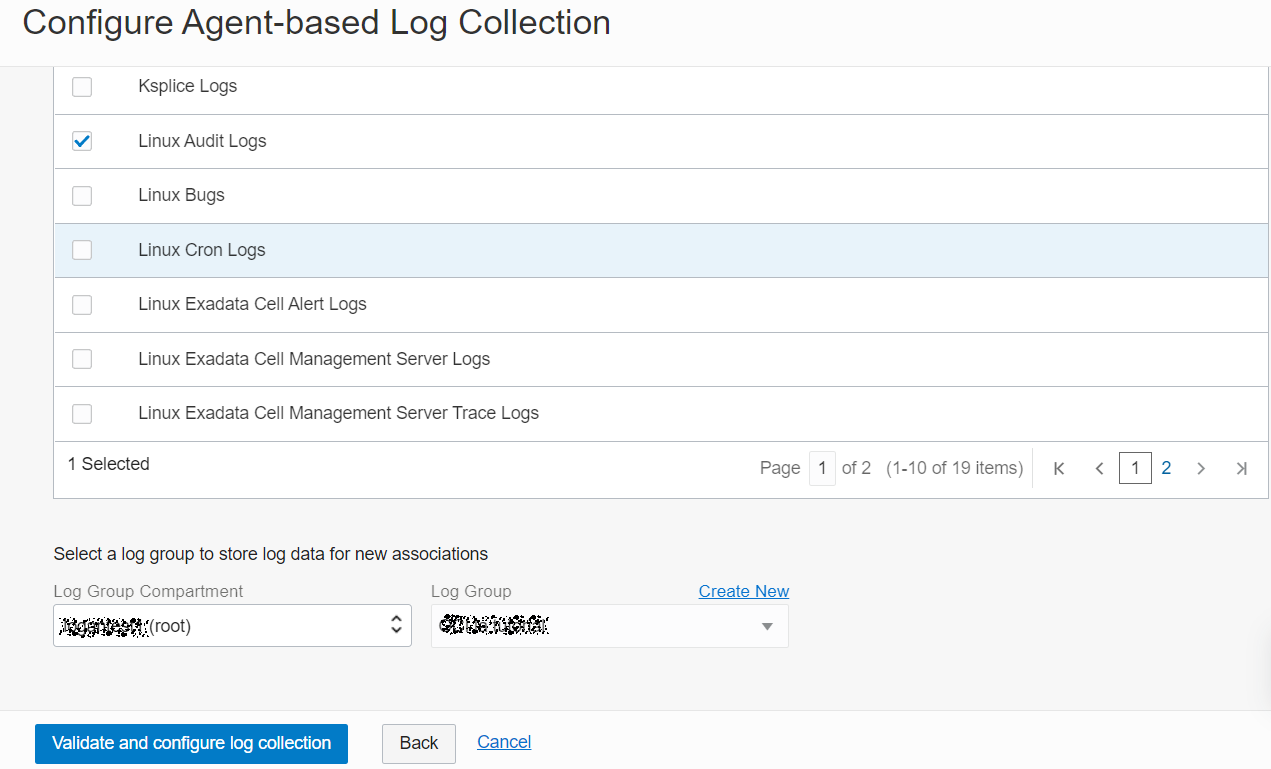
- After you select entities and sources to associate, specify the log group where the log data that gets collected, must be stored.
- Select the Log Group Compartment in which the log group is created.
- Select the Log Group in which the logs must be stored. Select logging_analytics_ociaudit log group that was created earlier while setting up ingestion.
If you want to create a new log group in the same compartment, click Create New. The Create Log Group dialog box opens. Specify the name for the new log group, and give a suitable description. Click Create.
- To complete the associations, click Validate and configure log collection.
- After the associations are created, the confirmation is displayed. You can also view the status of the activity. To view the details of the associations, click on the source name.
Upon successful configuration of the associations, the log collection begins. Click Take me to Log Explorer to view the log data.
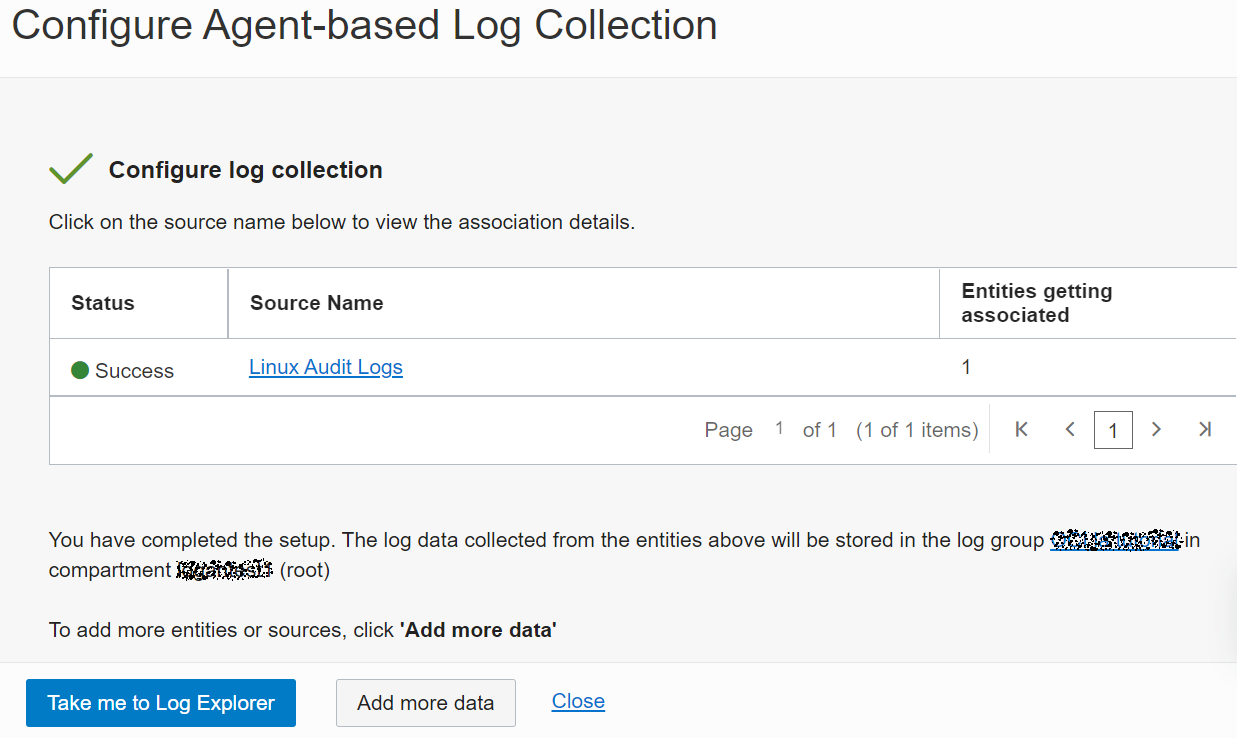
Description of the illustration ca8
Explore Logs
After you associate the source and entity you can now explore and visualize the data in the logs.
- View the Log Explorer.
Click the Scope Filter icon to the right of the of the Log Explorer.
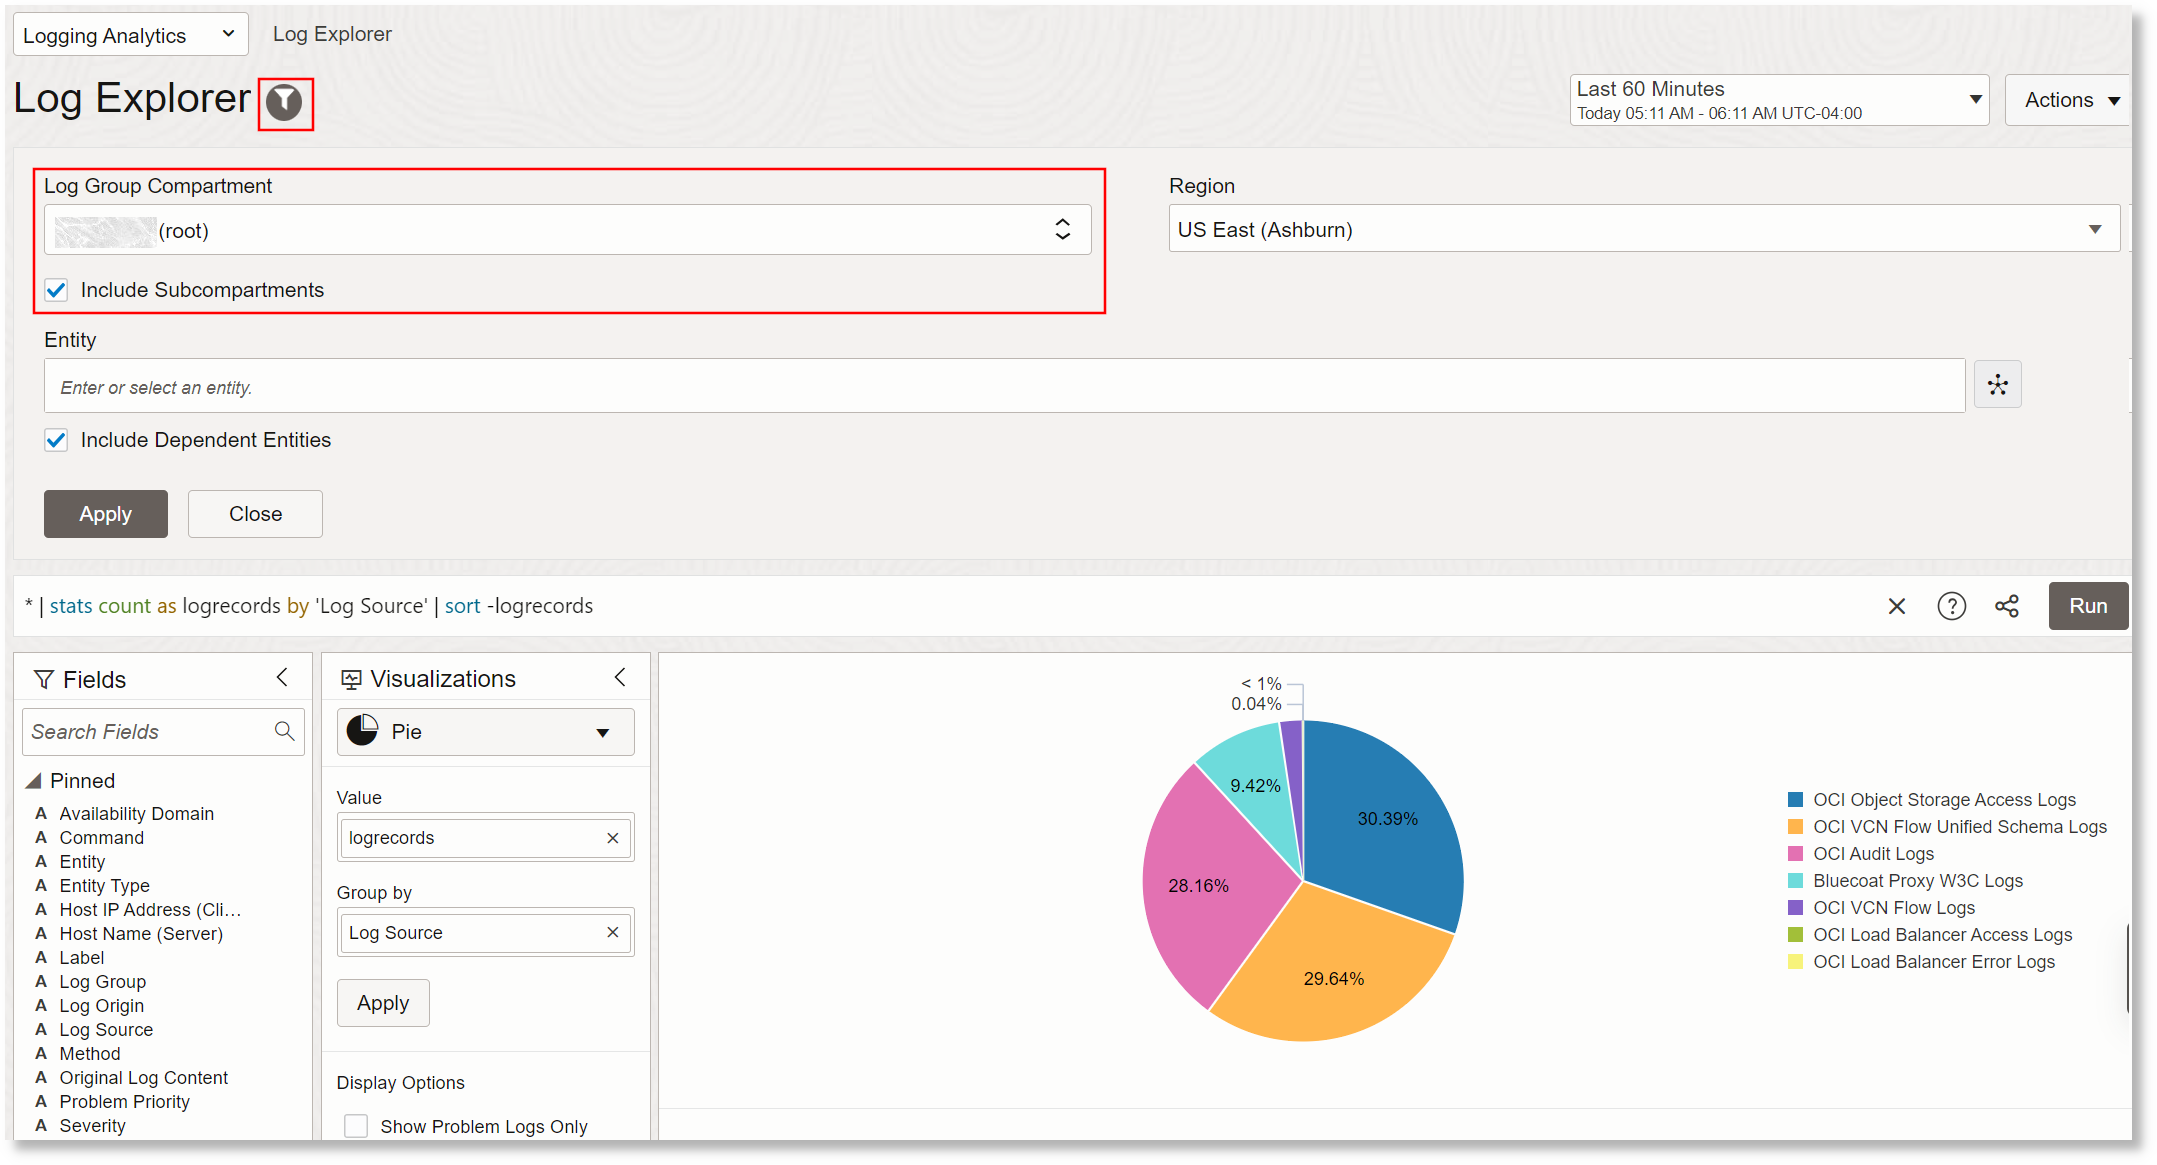
Description of the illustration el3
The default Log Group Compartment created earlier is automatically selected. However, if you want to change the log group compartment, then select it.
The Compartment selector lets you choose which log groups will be included in the search based on the compartment in which the log groups are located. When you choose a compartment here, this compartment plus all child compartments are all automatically included. By using the root compartment, you will be searching across all logs that your user has access to based on your user's compartment access policy and the log groups in those compartments.
After about two minutes, you should start seeing logs coming in for your sources. The Default Search is a pie chart showing the number of log entries coming in for all log sources.
- Explore Records View.
Click the Visualizations menu and change the selection to Records with Histogram:
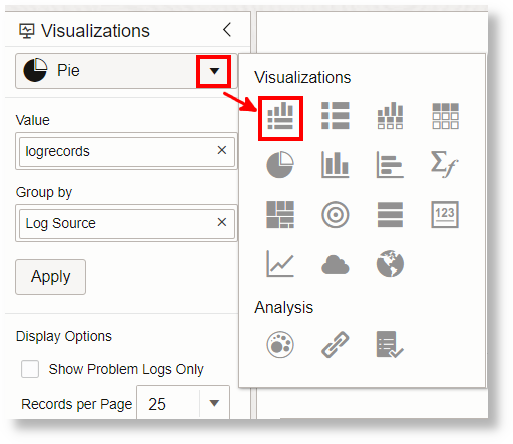
Description of the illustration el4
This view will show the log entries for all log sources interleaved by time:
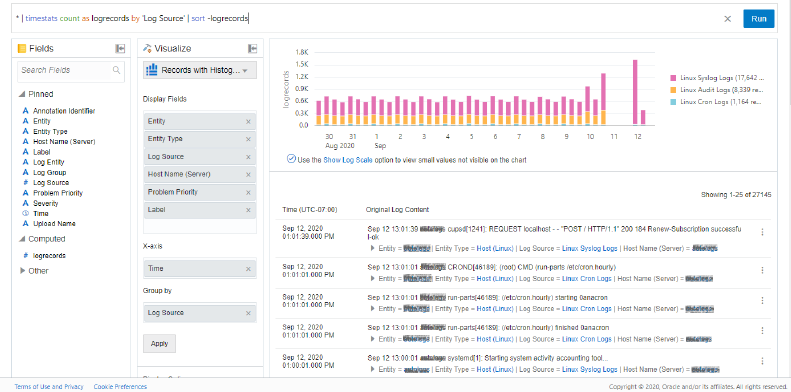
Description of the illustration el5 - Look at Cluster Analysis.
You can see in the search screen above that 27,145 log entries were collected for the last 14 days. This is a very large number of logs to inspect manually. In larger production environments you may have billions of log entries in a 14 day period.
Change the Visualization option to Cluster.
The screen changes to show clusters of log entries. Here you can see that the 27k of log entries has been reduced down to only 654 clusters, and we have identified 46 of those clusters that indicate a potential problem and 351 clusters that appear to be outliers. With a larger data set over a longer period of time, the cluster capabilities get better as there is more recurring pattern of data to compare against.
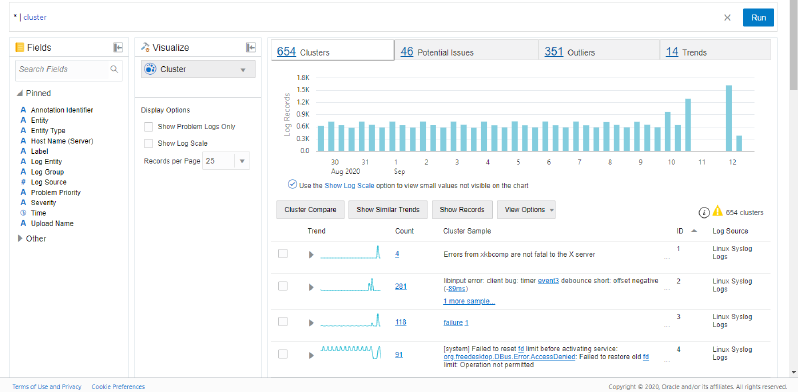
Description of the illustration el7
In the second entry, you can see there was a single type of log entry that has a count of 281. This means that log entries that follow this same pattern have occurred 281 times in the last 14 days. Parts of the cluster sample are shown as blue links. That is because across the 281 records with this similar shape, the parts in blue are varying for different log entries. Clicking on the blue links will let you see all of the variants of a specific instance.
- Use Facet Filtering.
Back on the Records with Histogram view, in the fields panel on the left side, you can click on a field you are interested in to see the values that have been parsed out of the logs. Counts and trends of occurrence of those values is shown. You can select values from here to narrow your search down.
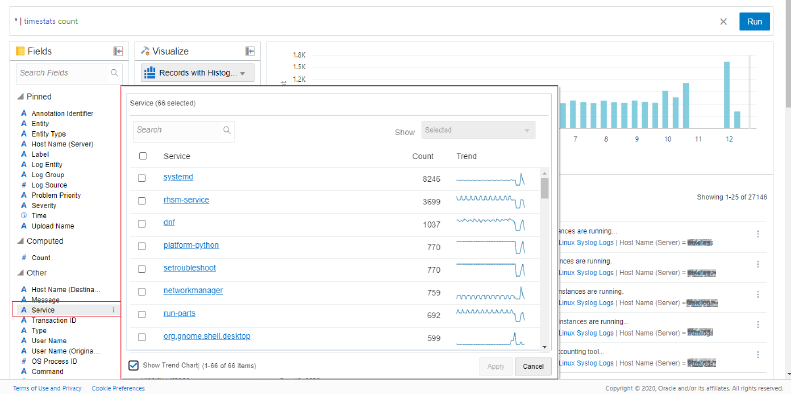
Description of the illustration el8 - Save a Search.
Saving a search is important for a couple reasons. First you may want to regularly use a search without having to rewrite it. You may also create searches that many people across an organization use to have a consistent view of important aspects. Also, a saved search can be used as a widget for a dashboard as you will see later in this walk-through.
Change your visualization to Horizontal Bar Chart.
By default, you will get a graph that has the Group By field chosen as Source (or it may be empty if you have made other query changes above). You can drag the field Other, Service to the Group By field, then click the Apply button.
You will see a bar chart showing the top used services on your host based on number of log entries like this:
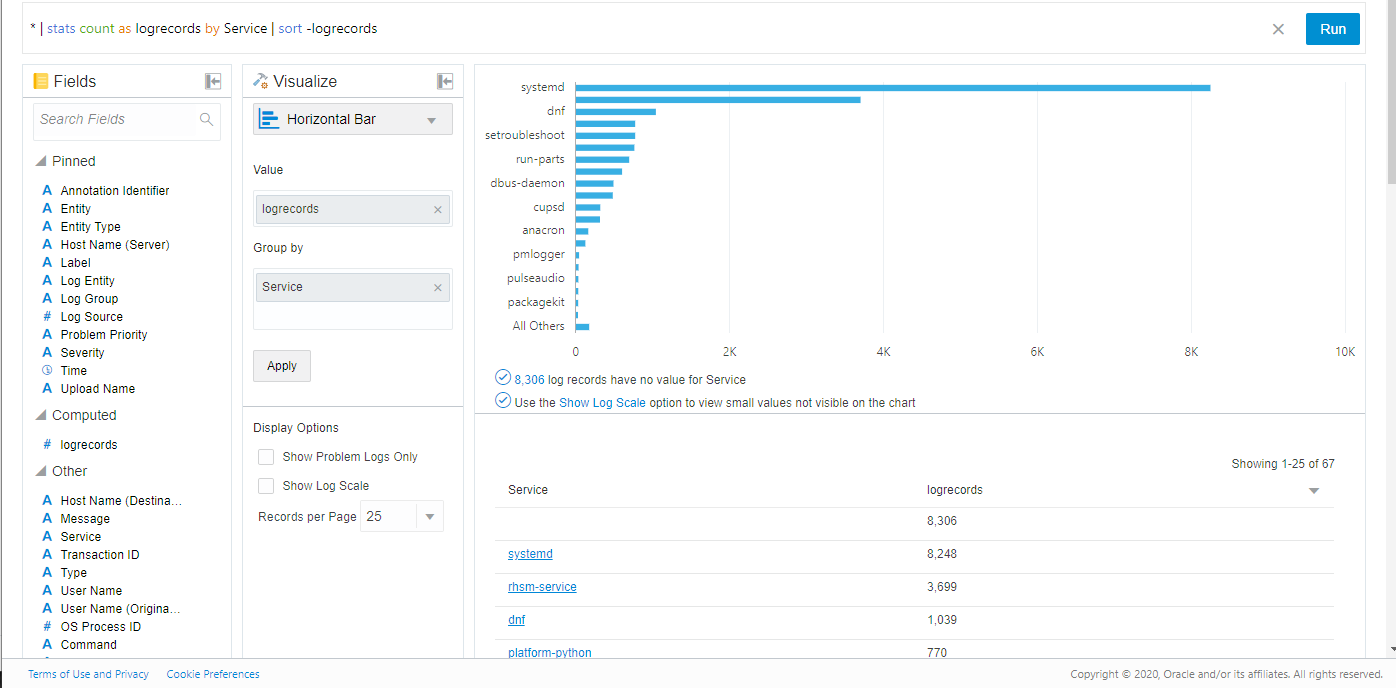
Description of the illustration el9
If you don't see the values descending in count, then make sure your query has as logrecords to create a computed field with that value and add
|sort -logrecordsto the search. That will sort descending by count of records. See the screenshot above for the query used.- Select the compartment to save the search.
- Give a name and description to the search.
- Click the Add to Dashboard checkbox.
- To add the saved search a widget to a new dashboard, select New Dashboard. Alternatively, you can add it to an Existing Dashboard.
- Select the compartment for the dashboard.
- In case of a new dashboard, specify a name and description for the new dashboard. Otherwise, select the existing dashboard name.
- Click the Save button.
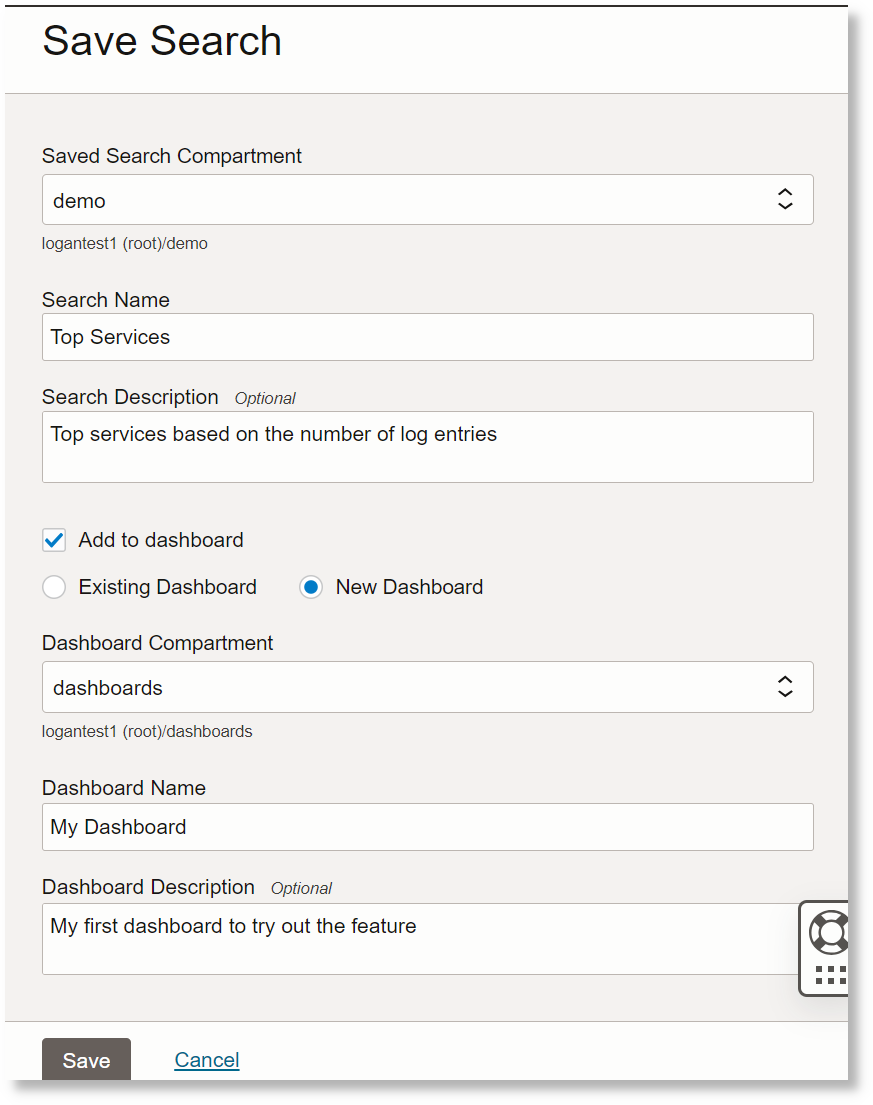
Description of the illustration el10
You will now see that the Log Explorer title has changed to include the name of the saved search you are working with. If you make changes here and go to Action, click Save, you can update the saved search.
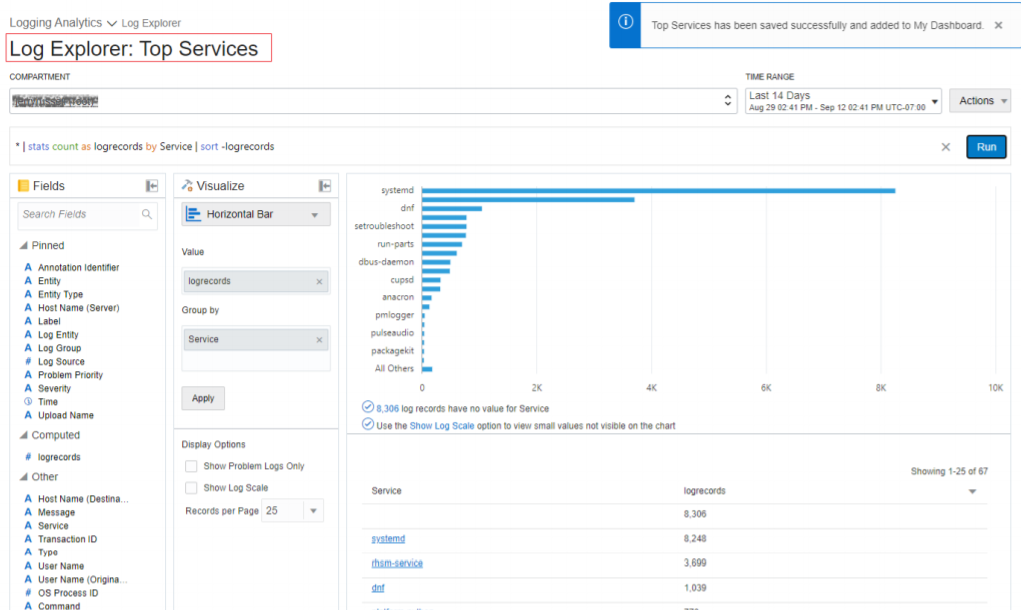
Description of the illustration el11 - View the Dashboard.
From the top navigation control, click on Log Analytics and select Dashboards.
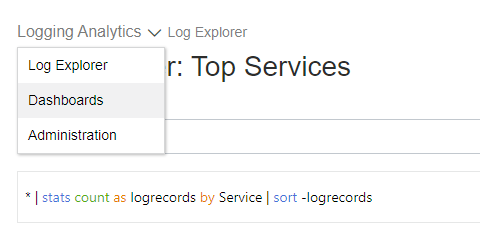
Description of the illustration el12
You will see a dashboard listing page with the dashboard you created earlier at the same time you saved the search. If you don't see your new dashboard here, make sure the compartment selected on the left is where you saved the dashboard.
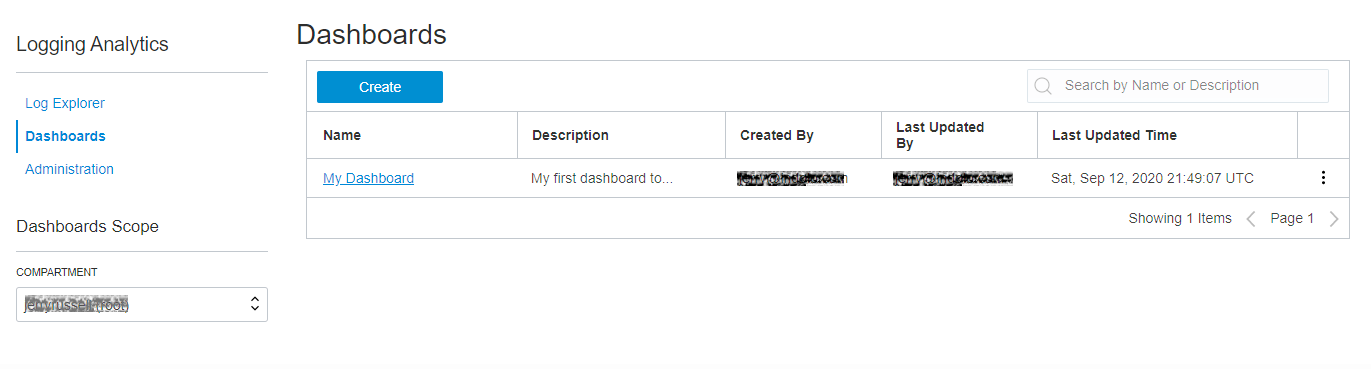
Description of the illustration el13
Click on the dashboard name to view the dashboard. Here you can add more saved search widgets, change the layout of the page and size of widgets. If you change the time range or compartment filter, it will change the data for all saved search widgets.
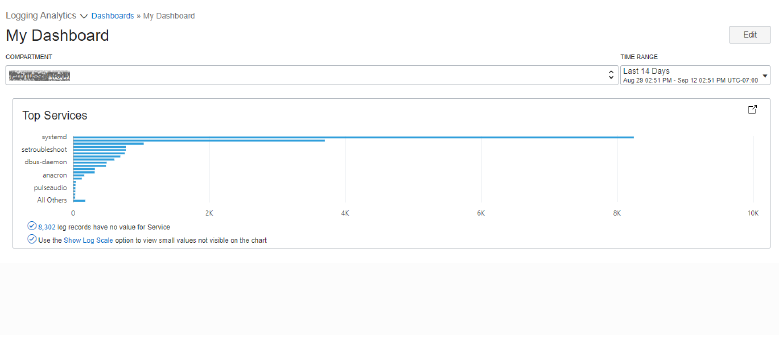
Description of the illustration el14
Keep exploring, this is just a sample of the many tasks you can perform using Log Analytics! Be sure to review the product technical content for more details on how to analyze logs.
Learn More
- Advanced Configuration Options for Management Agent
- Log Analytics Technical Content
- Create custom dashboards: Create Dashboards
- Other methods of ingesting logs: Ingest Logs
- Write queries to search for information in your logs: Query Search
- Log Analytics API
- Log Analytics Policies Catalog
OCI Log Analytics: Set Up Continuous Log Collection
F47877-10
December 2025
Set up continuous log collection in OCI Log Analytics service by installing the Management Agent.
This software and related documentation are provided under a license agreement containing restrictions on use and disclosure and are protected by intellectual property laws. Except as expressly permitted in your license agreement or allowed by law, you may not use, copy, reproduce, translate, broadcast, modify, license, transmit, distribute, exhibit, perform, publish, or display any part, in any form, or by any means. Reverse engineering, disassembly, or decompilation of this software, unless required by law for interoperability, is prohibited.
If this is software or related documentation that is delivered to the U.S. Government or anyone licensing it on behalf of the U.S. Government, then the following notice is applicable:
U.S. GOVERNMENT END USERS: Oracle programs (including any operating system, integrated software, any programs embedded, installed or activated on delivered hardware, and modifications of such programs) and Oracle computer documentation or other Oracle data delivered to or accessed by U.S. Government end users are "commercial computer software" or "commercial computer software documentation" pursuant to the applicable Federal Acquisition Regulation and agency-specific supplemental regulations. As such, the use, reproduction, duplication, release, display, disclosure, modification, preparation of derivative works, and/or adaptation of i) Oracle programs (including any operating system, integrated software, any programs embedded, installed or activated on delivered hardware, and modifications of such programs), ii) Oracle computer documentation and/or iii) other Oracle data, is subject to the rights and limitations specified in the license contained in the applicable contract. The terms governing the U.S. Government's use of Oracle cloud services are defined by the applicable contract for such services. No other rights are granted to the U.S. Government.
This software or hardware is developed for general use in a variety of information management applications. It is not developed or intended for use in any inherently dangerous applications, including applications that may create a risk of personal injury. If you use this software or hardware in dangerous applications, then you shall be responsible to take all appropriate fail-safe, backup, redundancy, and other measures to ensure its safe use. Oracle Corporation and its affiliates disclaim any liability for any damages caused by use of this software or hardware in dangerous applications.
Oracle and Java are registered trademarks of Oracle and/or its affiliates. Other names may be trademarks of their respective owners.
Intel and Intel Inside are trademarks or registered trademarks of Intel Corporation. All SPARC trademarks are used under license and are trademarks or registered trademarks of SPARC International, Inc. AMD, Epyc, and the AMD logo are trademarks or registered trademarks of Advanced Micro Devices. UNIX is a registered trademark of The Open Group.
This software or hardware and documentation may provide access to or information about content, products, and services from third parties. Oracle Corporation and its affiliates are not responsible for and expressly disclaim all warranties of any kind with respect to third-party content, products, and services unless otherwise set forth in an applicable agreement between you and Oracle. Oracle Corporation and its affiliates will not be responsible for any loss, costs, or damages incurred due to your access to or use of third-party content, products, or services, except as set forth in an applicable agreement between you and Oracle.