Before you Begin
Oracle Log Analytics service is a highly scalable, reliable, and real-time log analysis solution. Log Analytics automates the collection of historic and real-time logs from any on-premises or cloud resource. For more information on this service, see About Log Analytics.
This guide provides a very simple walk-through to get started with Log Analytics service. In about 10 minutes, you will set up Log Analytics, ingest OCI Audit Logs by automatically creating a service connector, review aggregated data in a dashboard and explore the available logs in the Log Explorer.
For a quick start guide to get started with Log Analytics and set up continuous log collection by installing Management Agent on your host, see Tutorial - OCI Log Analytics: Set Up Continuous Log Collection.
Background
A log source is the built-in definition of where log files are located and how to collect, mask, parse, extract and enrich the collected log data.
An entity refers to a real asset on your on-premises host where a Management Agent is installed. Each entity has an entity type, of over 100 pre-defined or any custom-created types.
Each log is assigned to a log group and this property is used to define who has access to query the logs.
A user of Log Analytics associates a log source to an entity to initiate the continuous log collection process through the OCI Management Agents. The concept of source-entity association only applies to continuous log collection through the agent.
For more information on these concepts, see Log Analytics Terms and Concepts.
What Do You Need?
Log in to an Oracle Cloud account where Log Analytics is not yet enabled. This user will be set up with the default access to the OCI Audit Logs in your environment.
To enable Oracle Log Analytics, the user must be a member of the Administrators group. See The Administrators Group, Policy, and Administrator Roles.
Enable Log Analytics
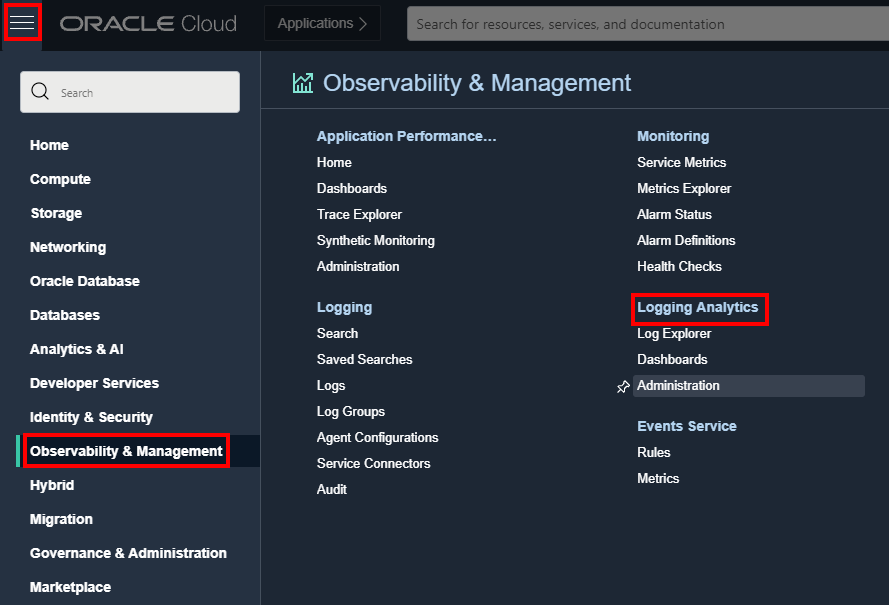
- The Log Analytics service is available from the top level OCI console menu. Navigate to Observability & Management and click Log Analytics.
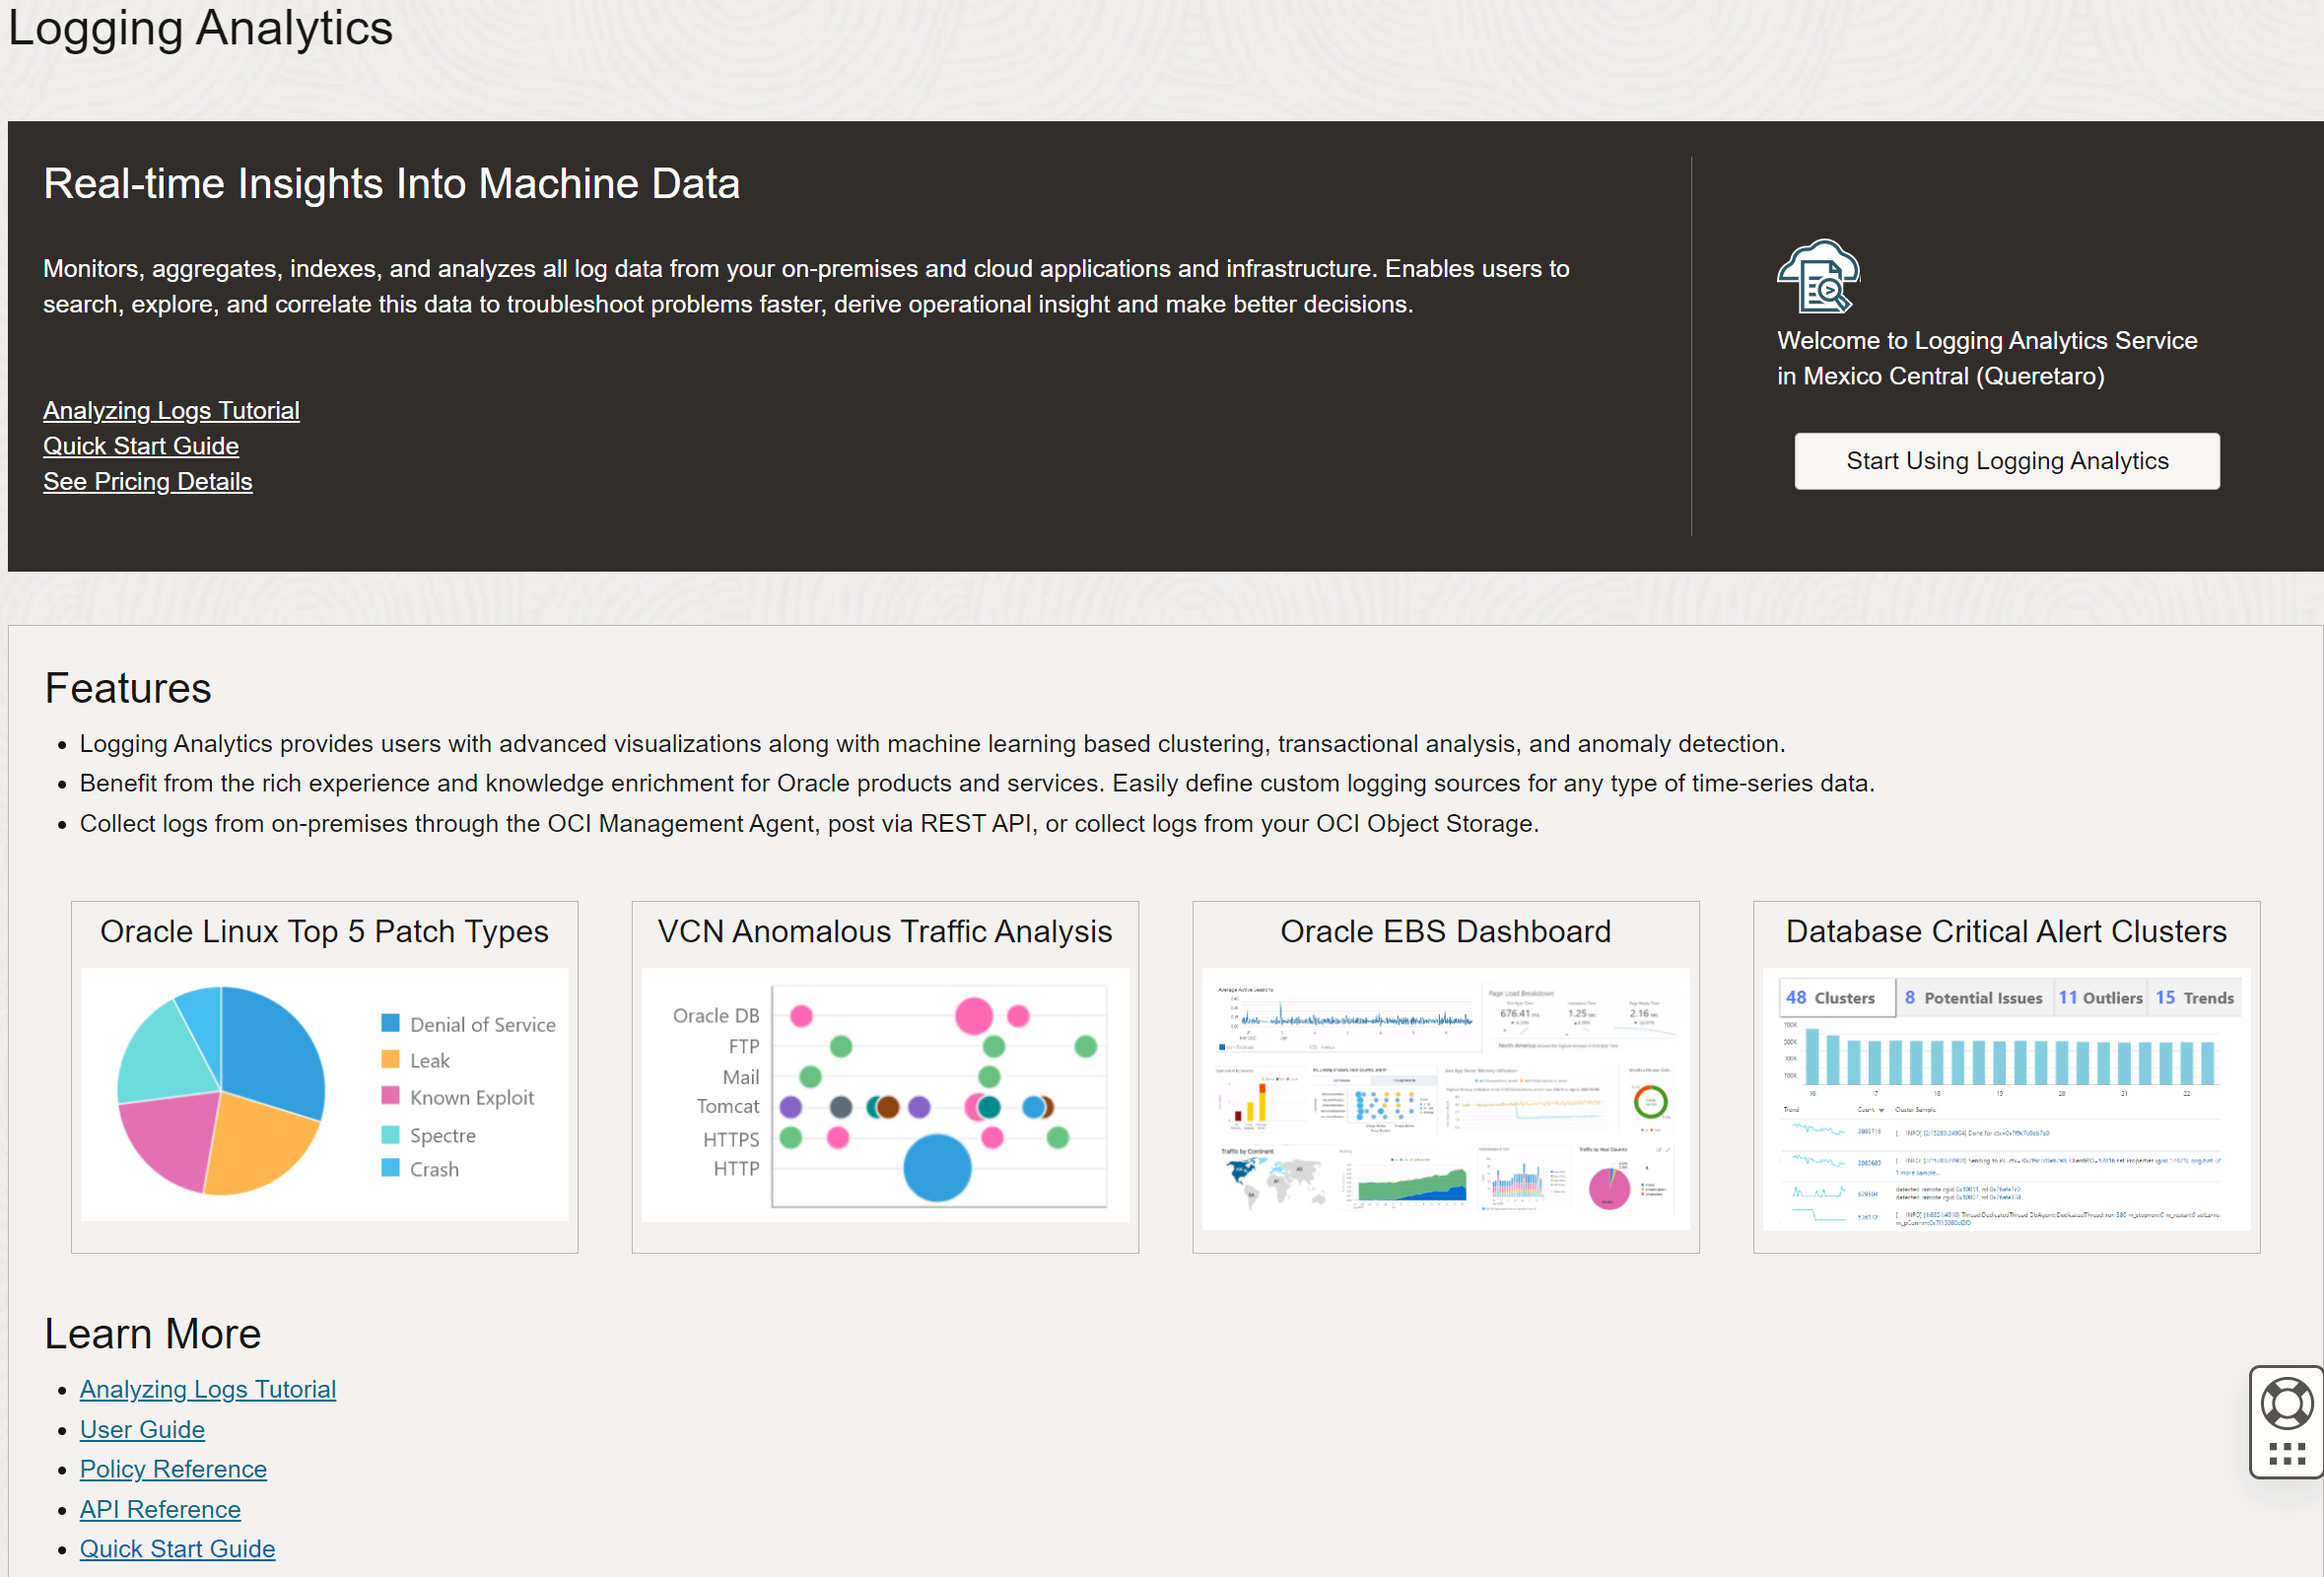
Description of the illustration 1 - If this is the first time you're using the service in this region, review the on-boarding page that will give you some high level details of the service and an option to start using Log Analytics. Click Start Using Log Analytics.
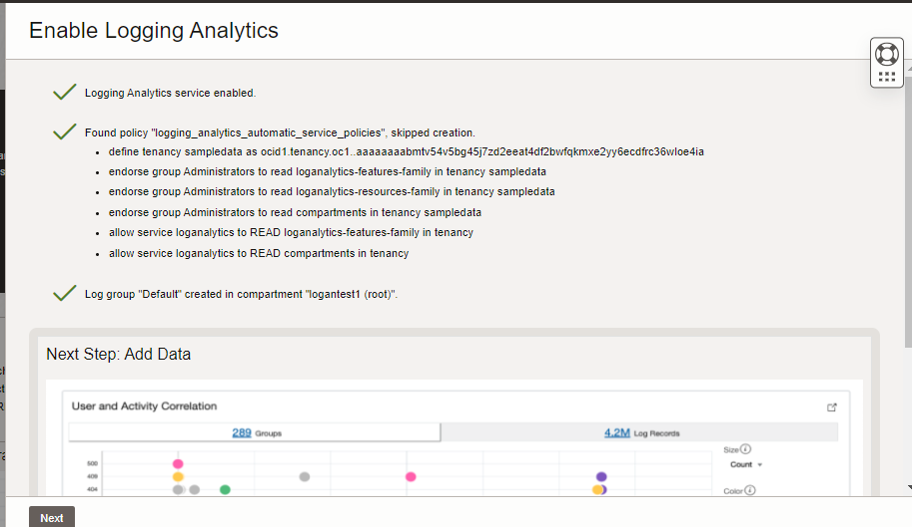
Description of the illustration 2 - Review the policies that are automatically created. For the list of policies created, see Policies Created While Onboarding Log Analytics. The log group Default is created if it does not already exist. After Log Analytics service is enabled successfully, click Next to continue.
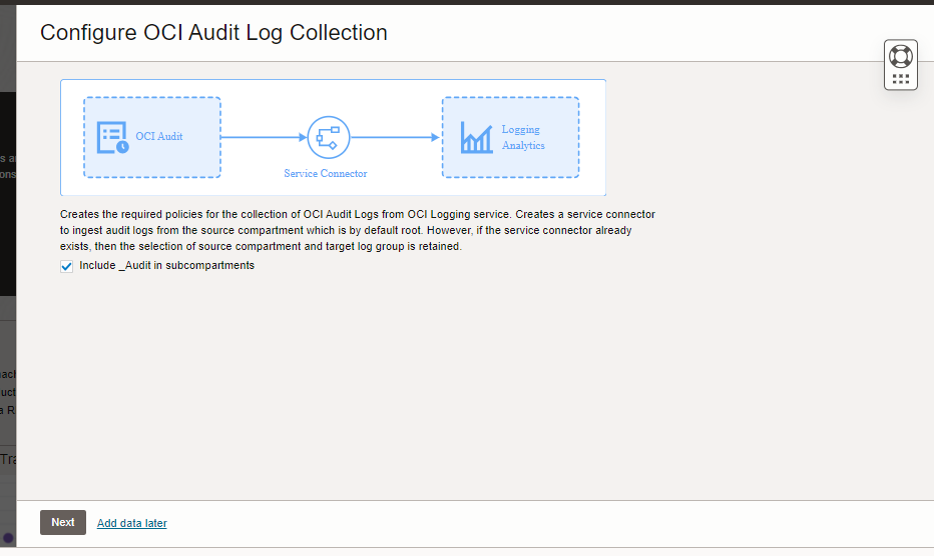
Description of the illustration 4 - The OCI Audit Log collection is configured. The check box Include _Audit in subcompartments is enabled by default. For the list of policies created to configure OCI Audit logs collection, see Policies Created While Onboarding Log Analytics. Click Next.
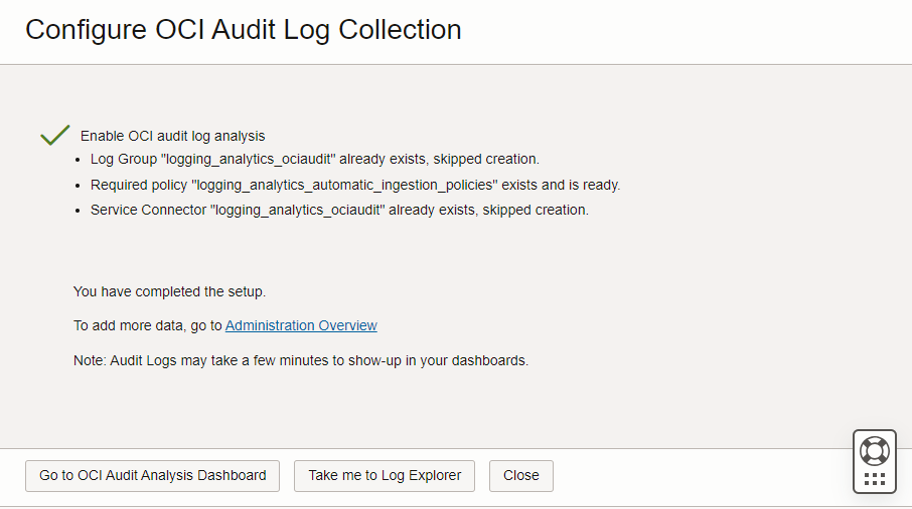
Description of the illustration 5 - After the OCI Audit Logs Analysis is enabled successfully, click Go to OCI Audit Logs Dashboard and view the analysis.
Description of the illustration 8
Dashboards Overview
Take a look at the example dashboard, which is based on the data automatically collected from the OCI Audit Logs during the Log Analytics enabling process. Depending on the cloud account you used, this data will vary.
Note that this environment has 58 active users and over 3 million OCI Audit Logs collected in the last 14 days. You can see the data by compartments, examine the Trend, and Active Users Per Hour.

Lower on the same page, note some further analysis of the data: correlation and grouping of information to make it easy to identify issues.


Visualize and Explore Log Data
Learn About Log Analytics User Interface
The interactive data visualizations in OCI Log Analytics enable you to get deeper insights into your log data. Depending on the data you want to filter, group, and compare, you can choose various visualization types, from a rich set of options. This section is an introduction to log exploring and data visualization.
Navigate to Log Analytics and click Log Explorer. The following image presents the main parts of the Log Explorer user interface:

-
Query bar, with Clear, Search Help, and Run buttons at the right end of the bar.
-
Time range menu, and Actions menu where you can find actions such as, Open, Save, and Save as.
-
Fields panel, where you can select sources and fields to filter your data.
-
Visualization panel, where you can select the way to present search data in a form that helps you.
-
Main panel, where the visualization outputs appear above the results of the query.
Tip:
Use the browser Back button to return to a previous page. Do not use the Refresh button.Explore Logs
- In Log Explorer, click the Filter icon to open the Scope Filter.
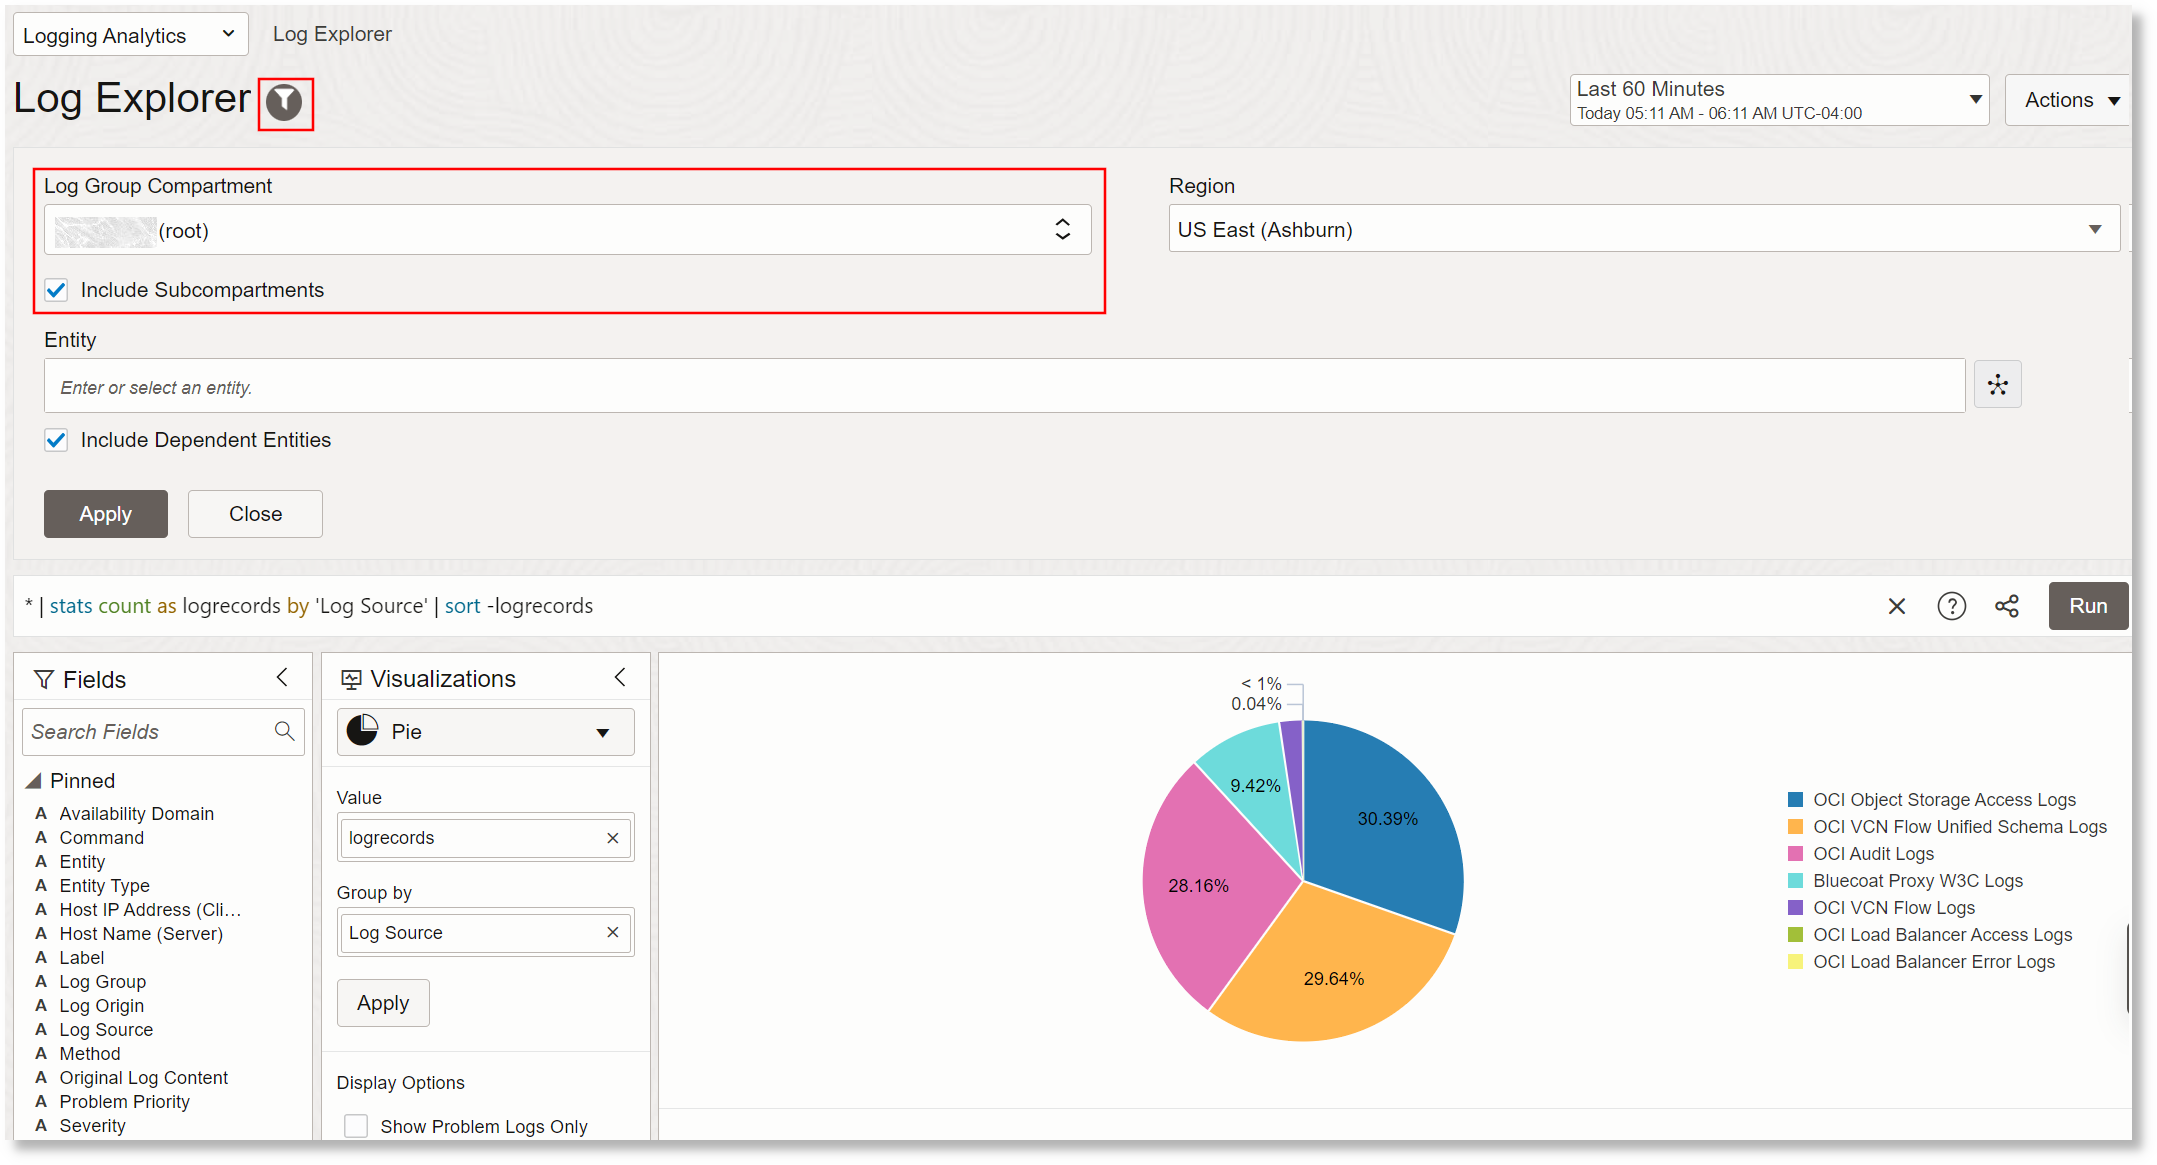
Description of the illustration 13
If the filter is not set with the Log Group Compartment that was created earlier while setting up ingestion, then select logging_analytics_ociaudit.
The Compartment selector lets you choose which log groups will be included in the search based on which compartment those log groups are in. When you select a compartment here, this compartment plus all child compartments are all automatically included. By using the root compartment, you will be searching across all logs that your user has access to, based on your user's compartment access policy and the log groups in those compartments.
After a minute, you should start seeing logs coming in for your sources.
Set the Time range to Last 14 Days.
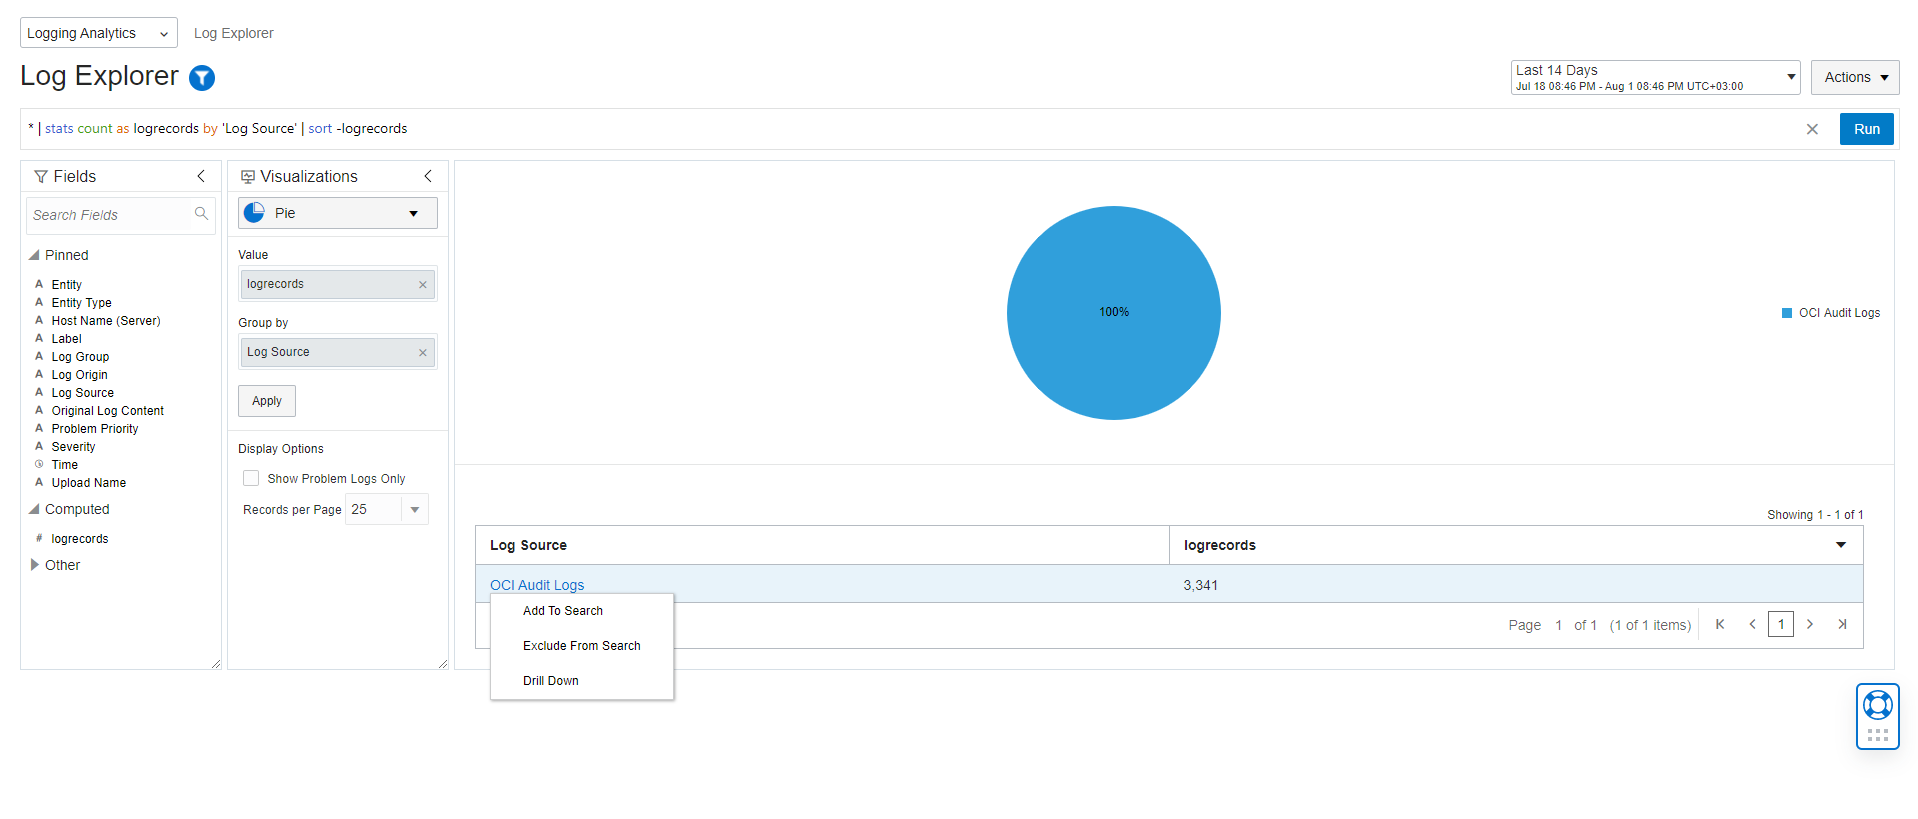
Click OCI Audit Logs, then click Drill Down, as shown in the image below:
Description of the illustration 14
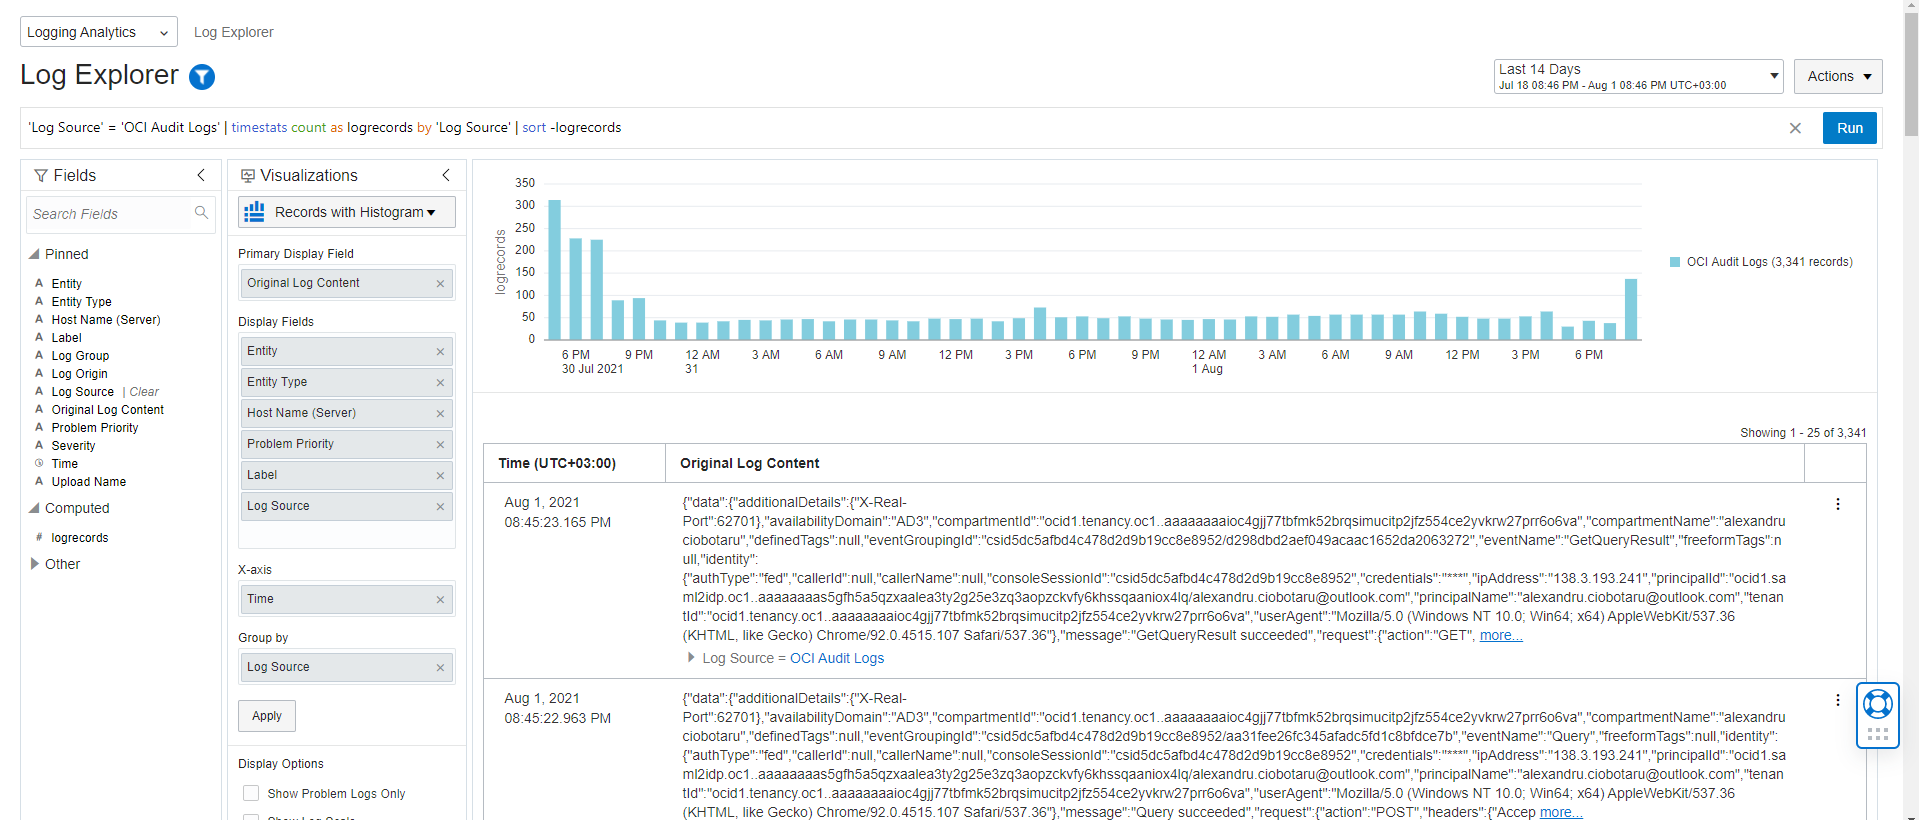
By default, your log data is displayed as Records with histogram to help reduce the size of the data set:
Description of the illustration 15
You can further click a specific segment in the histogram to drill down to the corresponding set of log records and to view the original log content.
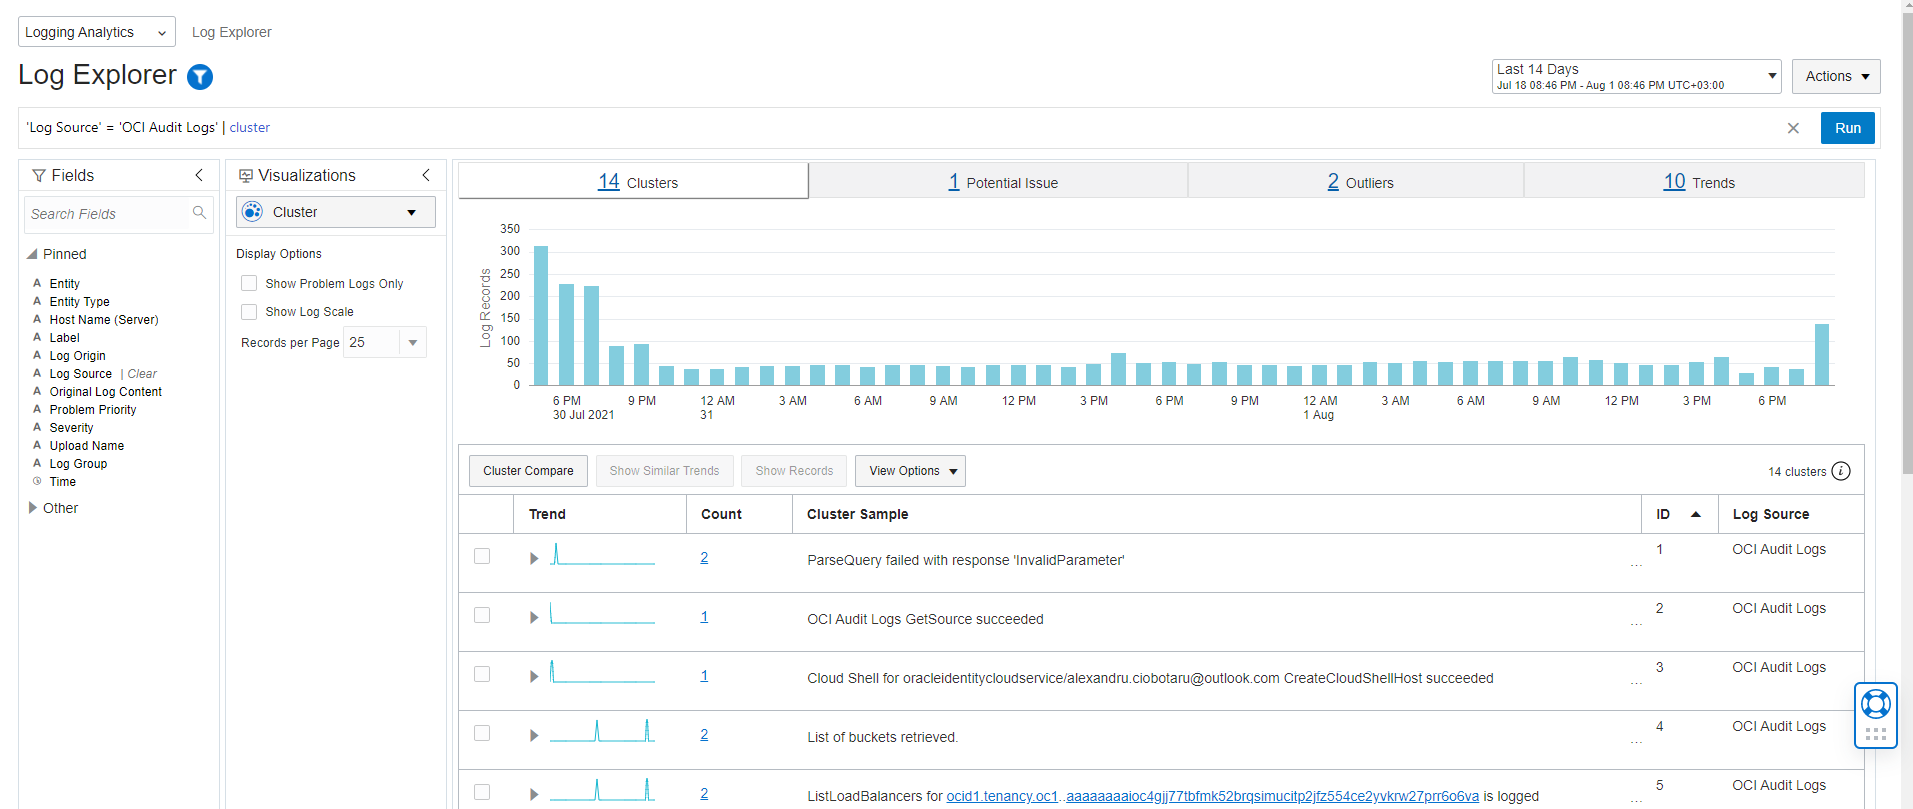
Clustering uses machine learning to identify a pattern of log records and then groups the logs that have similar patterns. You can see in the search screen above that 6,501 log entries (the number of logs can vary) were collected for the last 14 days. This is a very large number of logs to inspect manually. In larger production environments, you may have billions of log entries in a 14 day period.
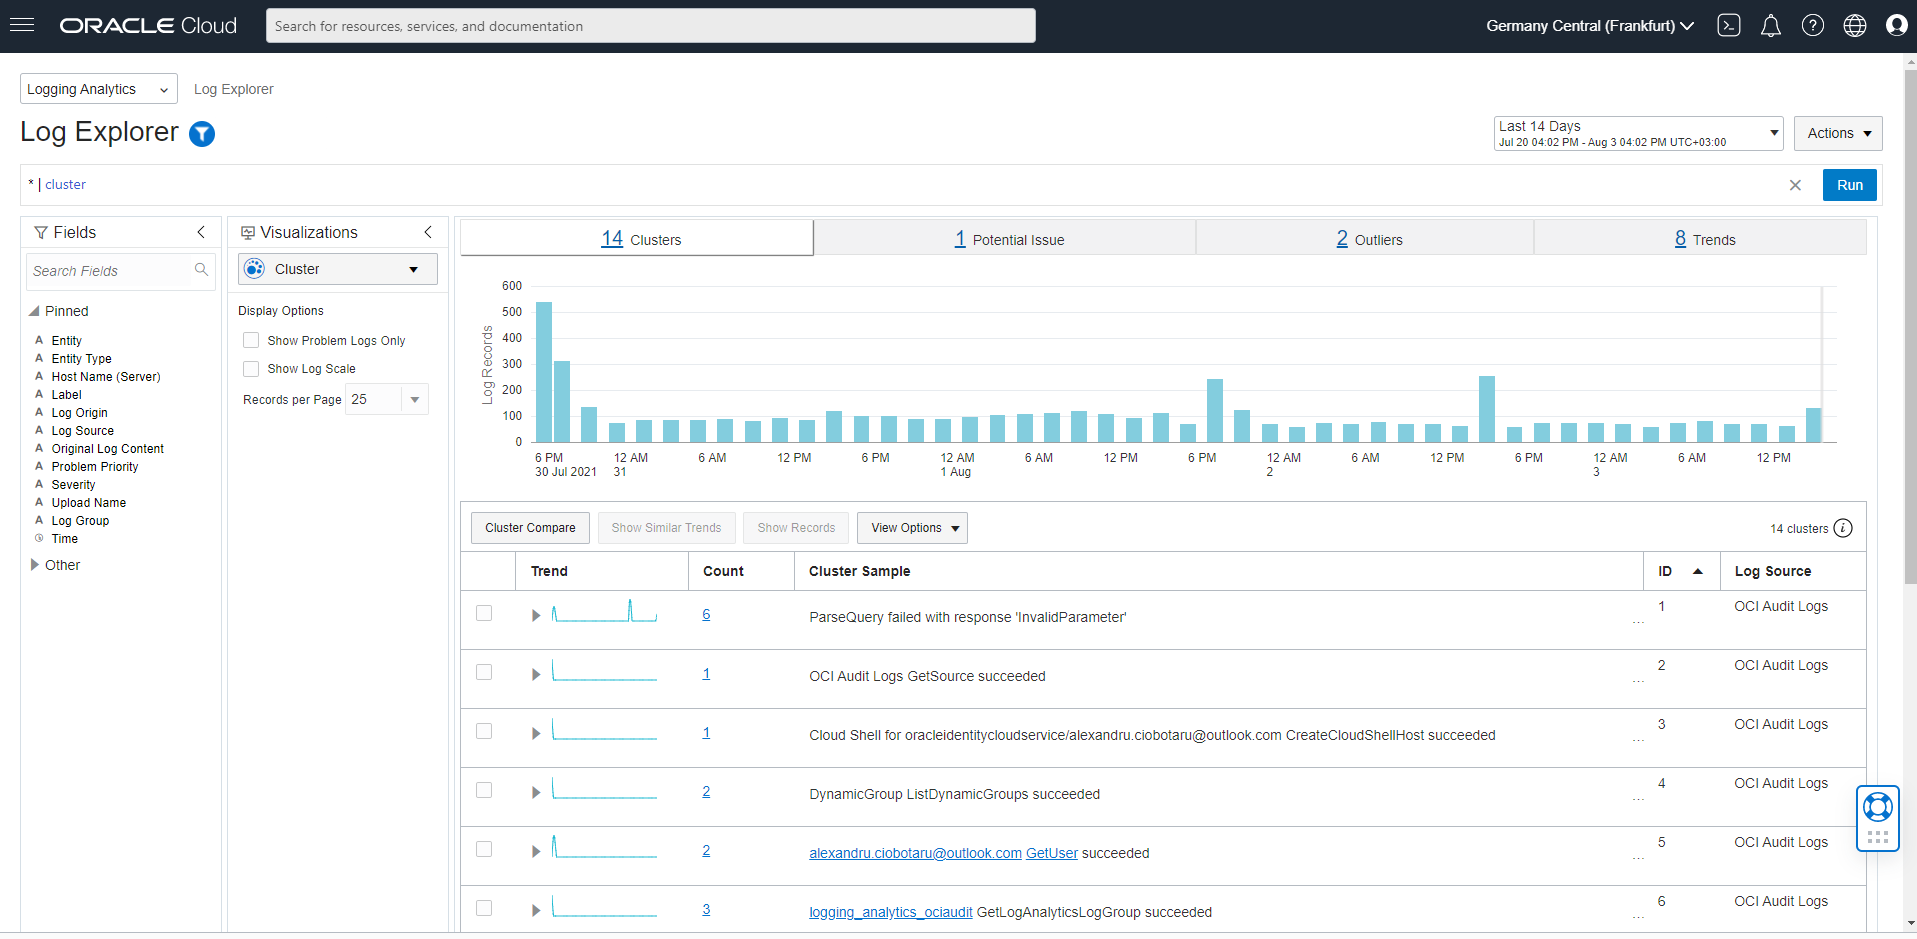
Change the Visualization option to Cluster to take a look at the Cluster Analysis options.
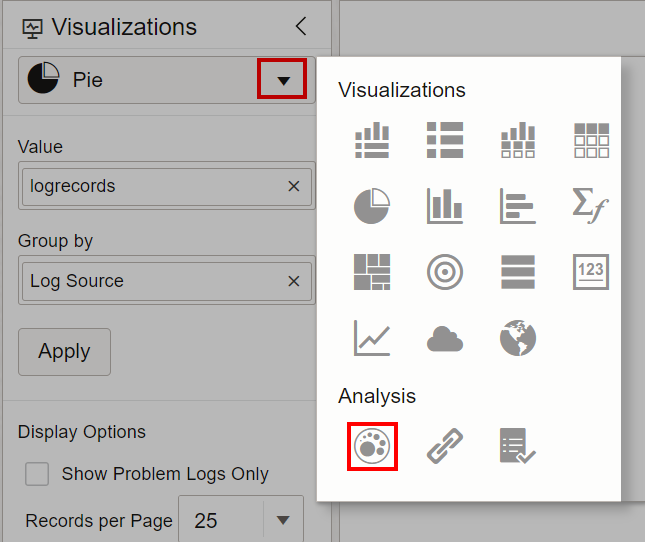
Description of the illustration 16
The screen changes to show clusters of log entries. Here, you can see that 6k log entries are reduced to only 14 clusters, and we have identified 1 of those clusters that indicate a potential problem and 2 clusters that appear to be outliers. With a larger data set over a longer period of time, the cluster capabilities get better as there is a recurring pattern of data to compare against.
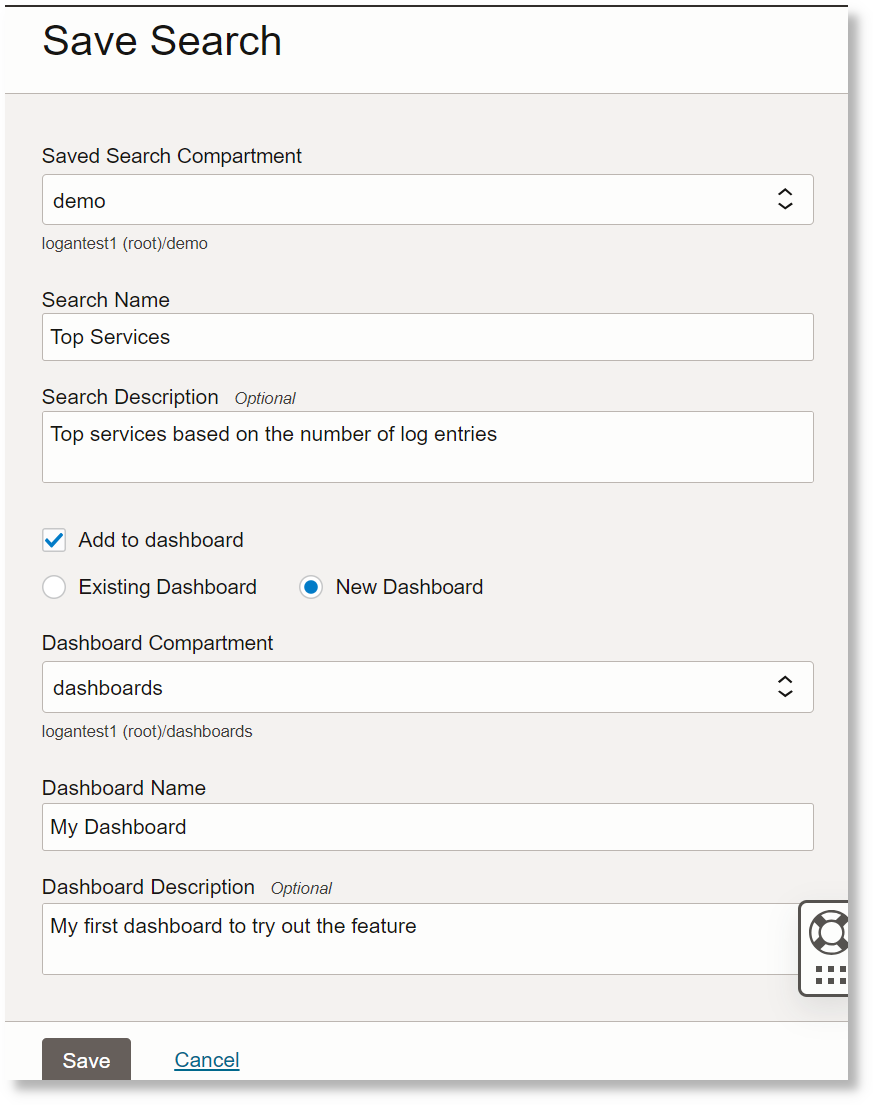
Description of the illustration 17 - Save a Search.
Saving a search is important for a couple of reasons. First, you may want to regularly use a search without having to rewrite it. You may also create searches that multiple people across your organization use. This provides a consistent view of important data. Second, a saved search can be used as a widget for a dashboard as you will see later in this walk-through.
Change your visualization to Horizontal Bar Chart.
- Select the compartment to save the search.
- Give a name and description to the search.
- Click the Add to Dashboard checkbox.
- To add the saved search a widget to a new dashboard, select New Dashboard. Alternatively, you can add it to an Existing Dashboard.
- Select the compartment to save the dashboard.
- In case of a new dashboard, specify a name and description for the new dashboard. Otherwise, select the existing dashboard name.
- Give a name and description to the new dashboard.
- Click Save.
Description of the illustration 18
You will now see that the Log Explorer title has changed to include the name of the saved search you are working with. If you make changes here, navigate to Action and click Save to update the saved search.
Get Started with Queries
Using queries and searches is a more advanced way of searching and analyzing your logs. A search is a series of commands delimited by a pipe ( | ) character. The result from the prior command is used as input for the next command. Some commands search for data and other commands aggregate the results. The first command in a query is the search command containing:
- keywords or phrases
- boolean expressions
- wildcards
- field name/value pairs
Here is an example query with a search and aggregate command that would search your logs and show how many distinct load balancers are monitored. A command like this can be broken into four separate sections as follows:

- Search all logs from the source OCI Load Balancer Access Logs
- Aggregate results from the previous subquery
- Count distinct occurrences of a field
- Save the aggregate results in a new temporary field
Tip:
Click Search Help, at the right side of the search bar, to open a panel with more information about search queries. The help wizard provides the format and syntax of the queries you can compose. Run the example queries starting from the very basic search to advanced analysis and familiarize yourself with the query reference. The wizard gives you some tips and shortcuts to make your search efficient. A view of the typical use cases of the common command results is available.In this section, you can try a few simple search commands to get an idea of how the query search works.
Navigate to Log Analytics and click Log Explorer.
Copy the following queries and paste them in the query bar, then press Run.
-
failed
This simple query shows you all log records containing the keyword failed.
Sample Output:
Description of the illustration 20
-
(error or failure) NOT success
Simple queries can be combined with logical operators to build more complex ones. This query shows you all the log records containing the keywords failed or error.
Sample Output:
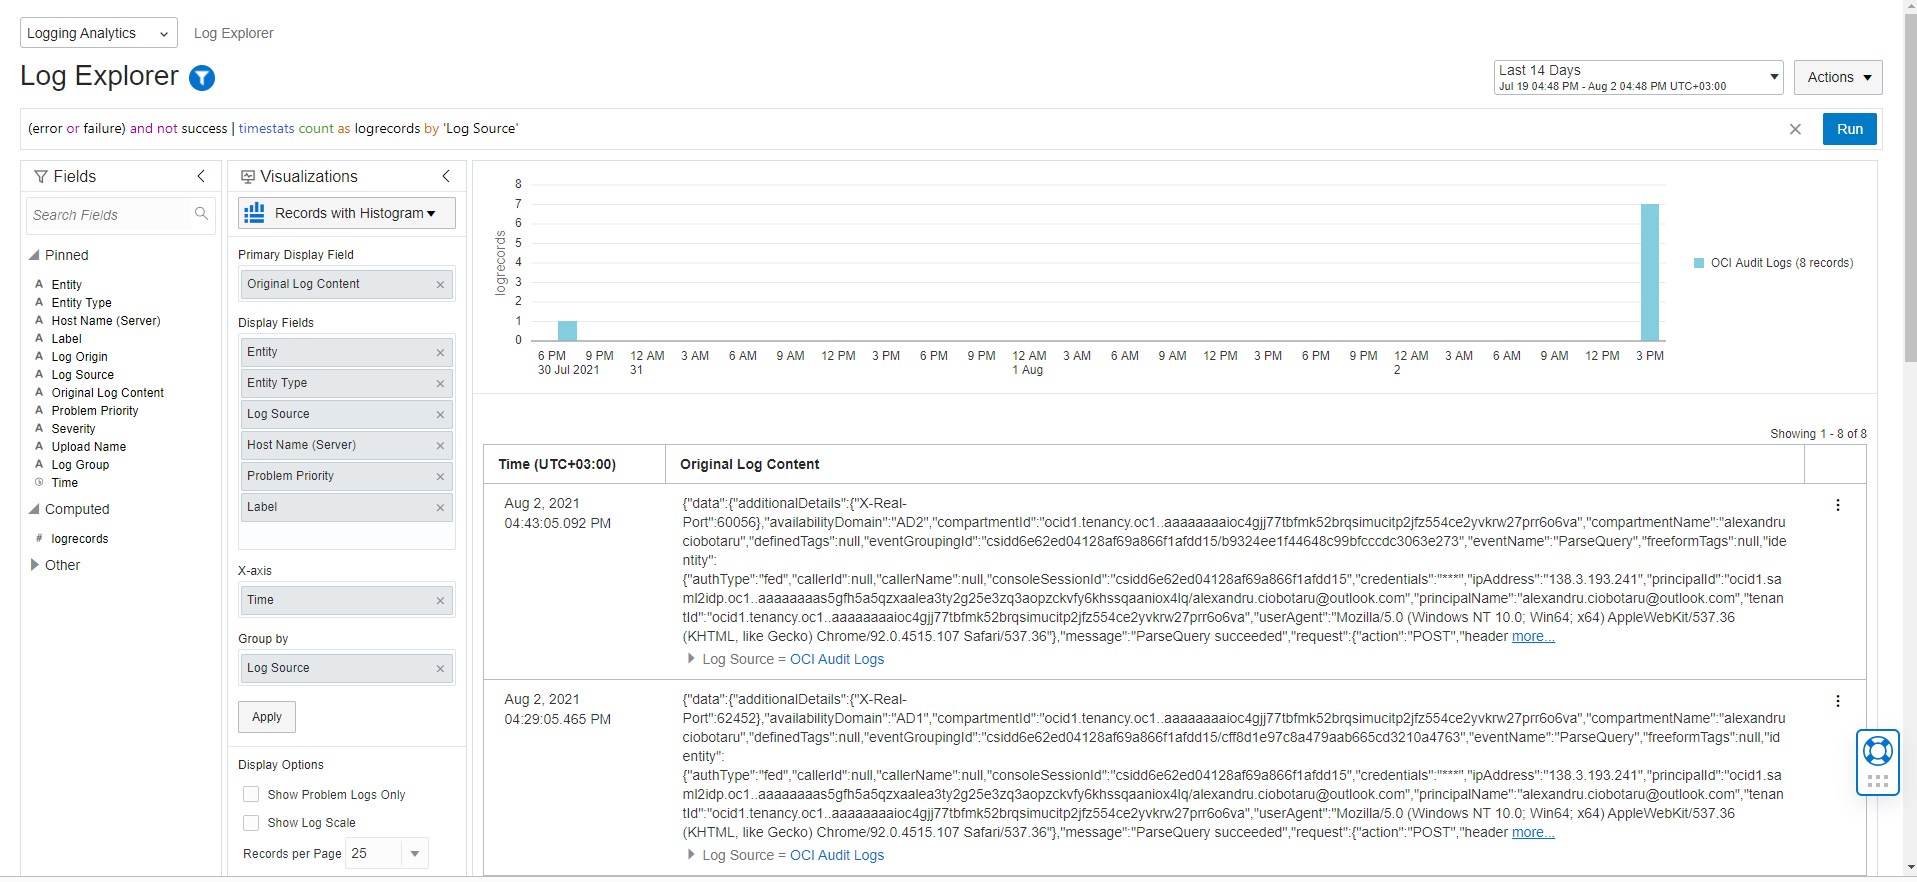
Description of the illustration 21
-
fail*
Wildcard characters ( * ) can be used in queries to substitute one or more characters in a string. This query shows you all logs containing the wildcard expression (a string that begins with fail).
Sample Output:
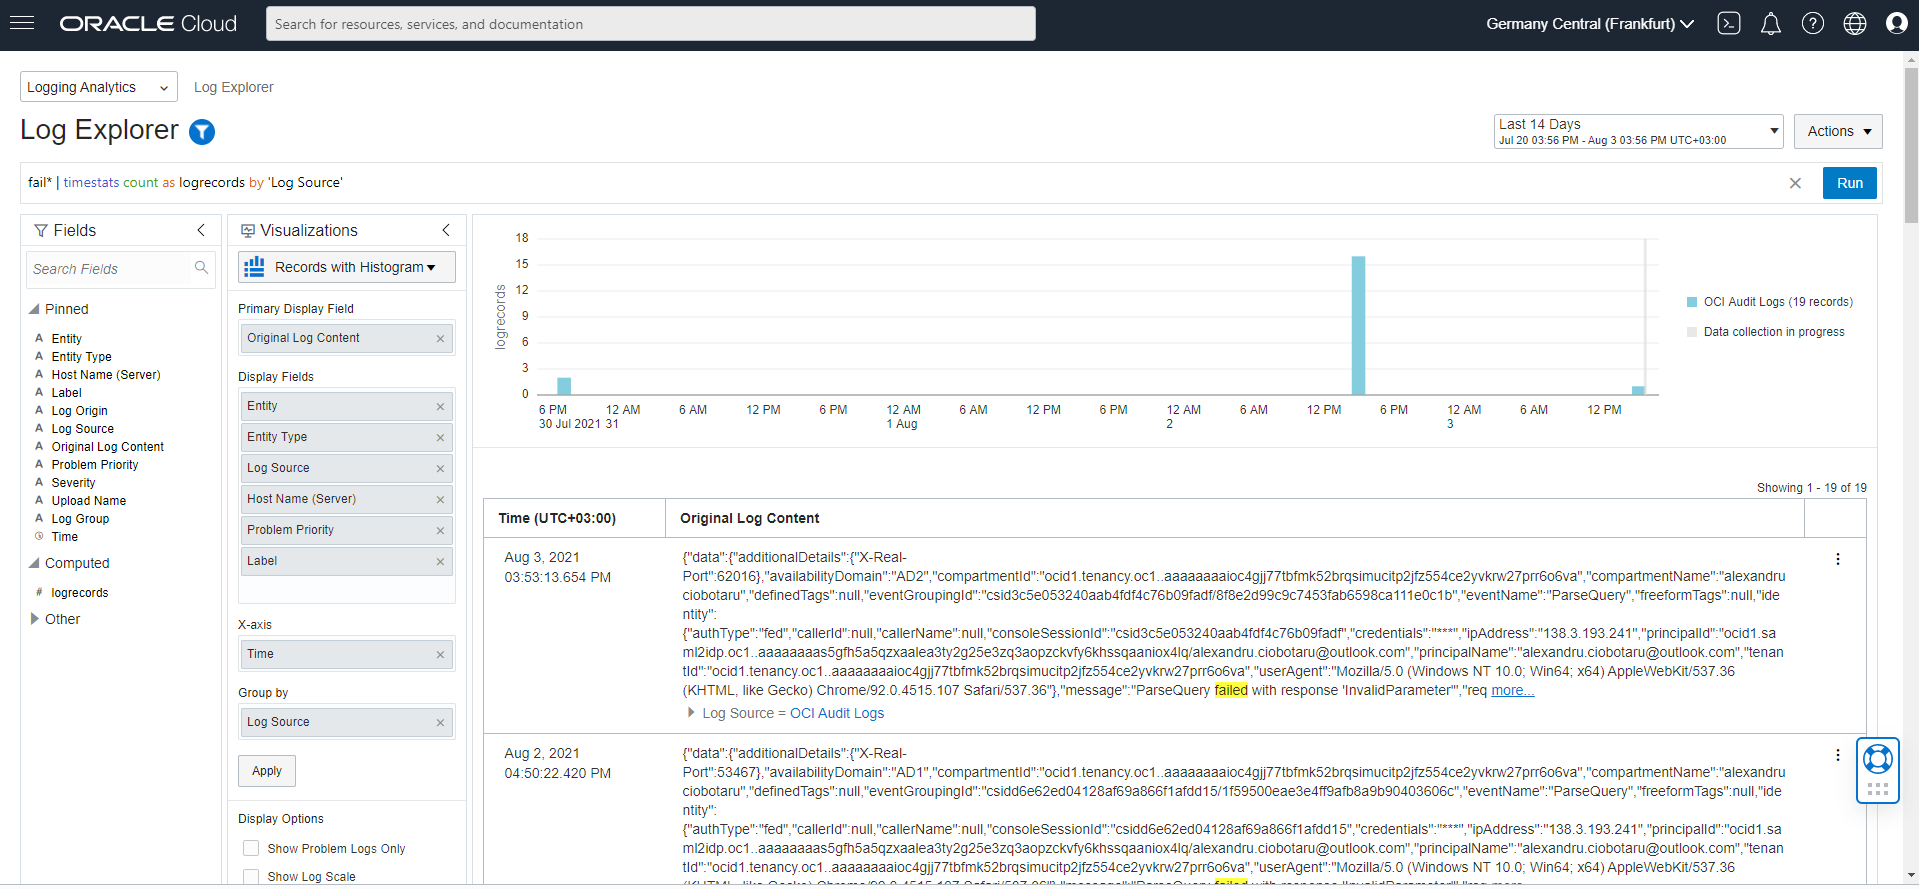
Description of the illustration 22
-
* | stats count
This simple query calculates the total number of log records.
Sample Output:
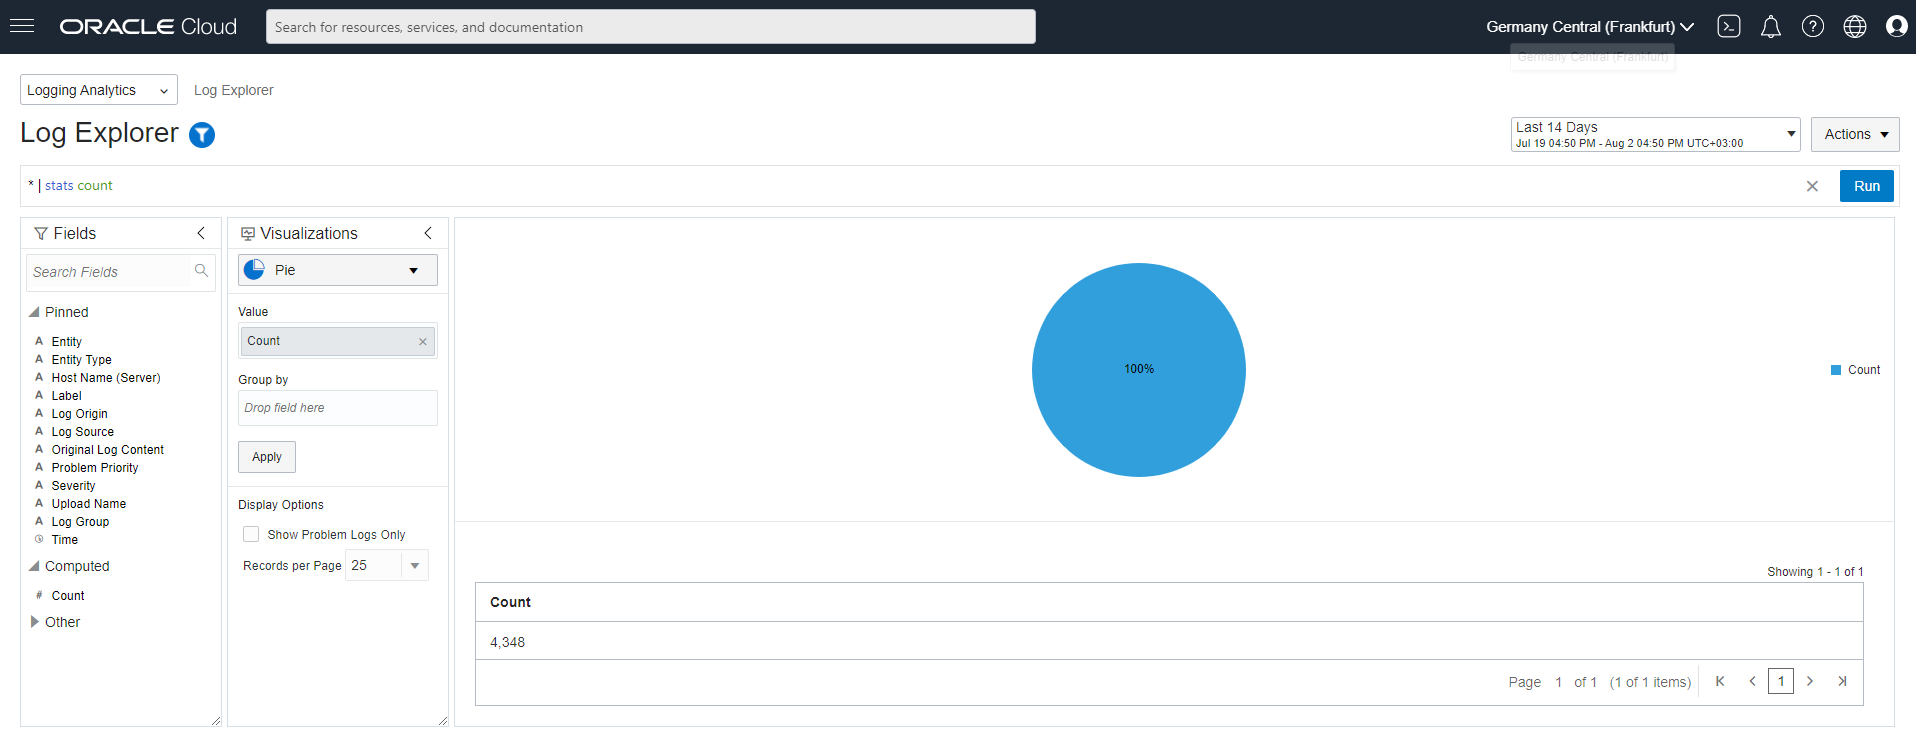
Description of the illustration 23
-
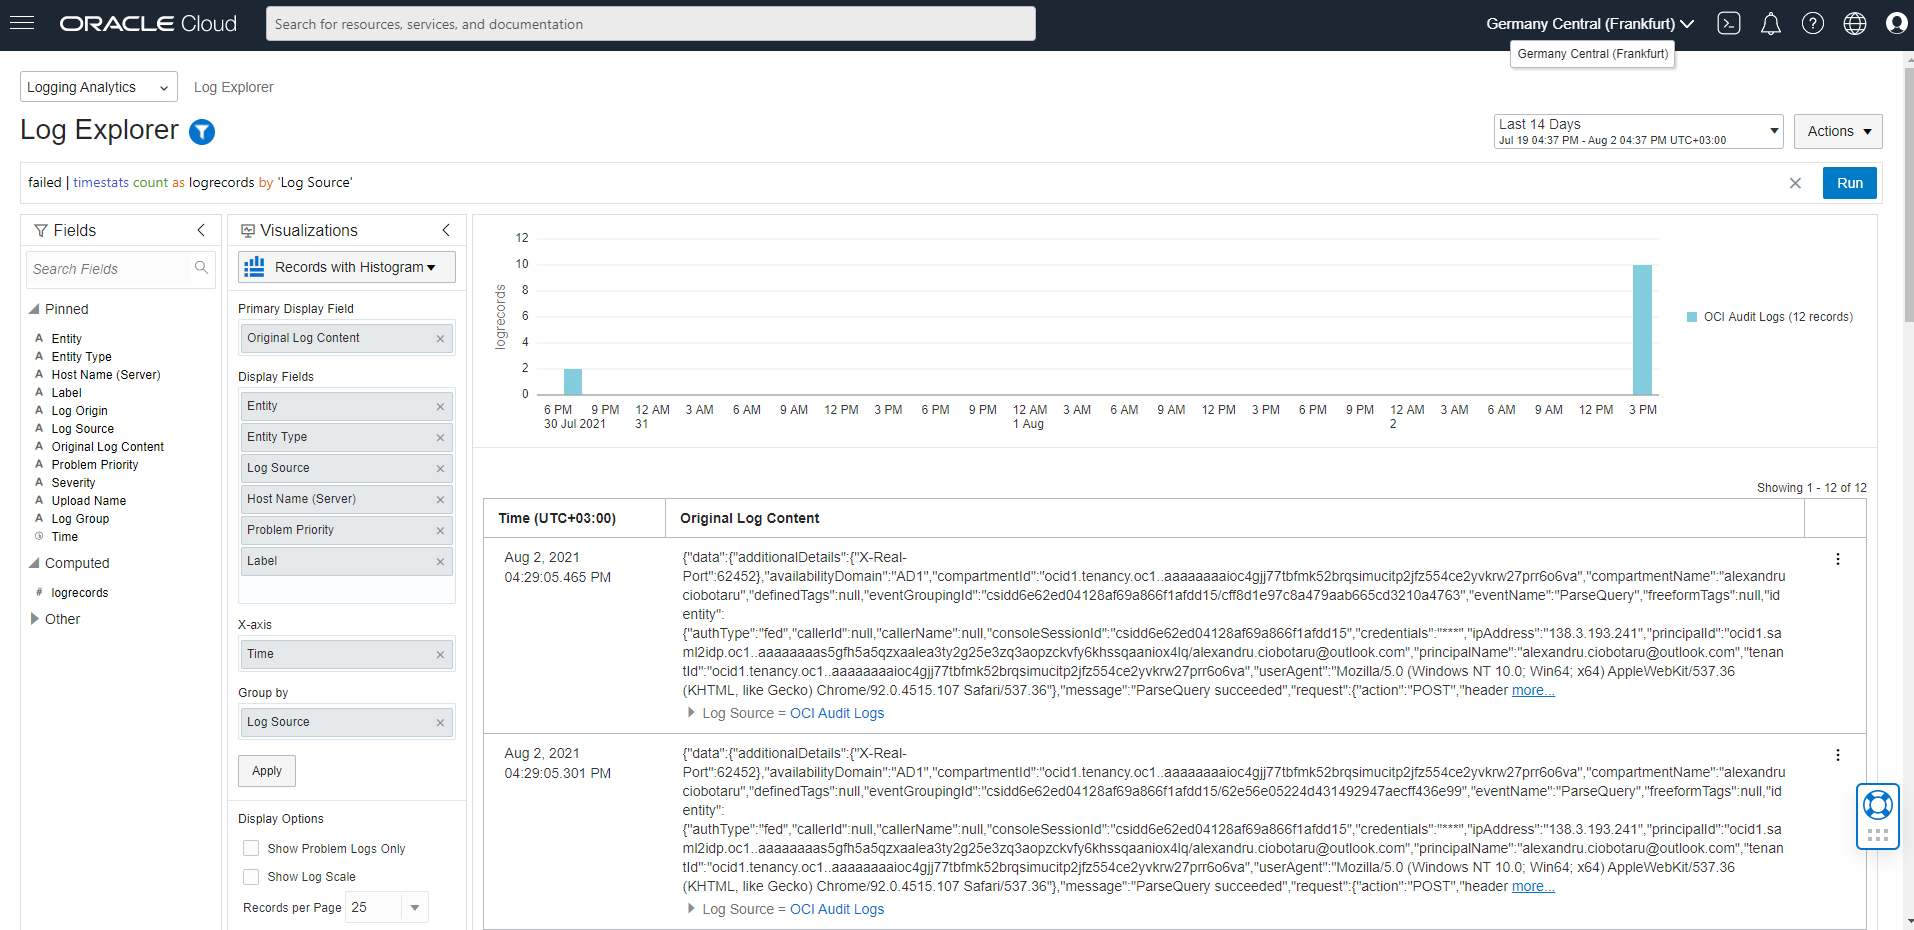
* | timestats count by 'Log Source'
This query shows the trend of the number of log records for different log sources.
Sample Output:
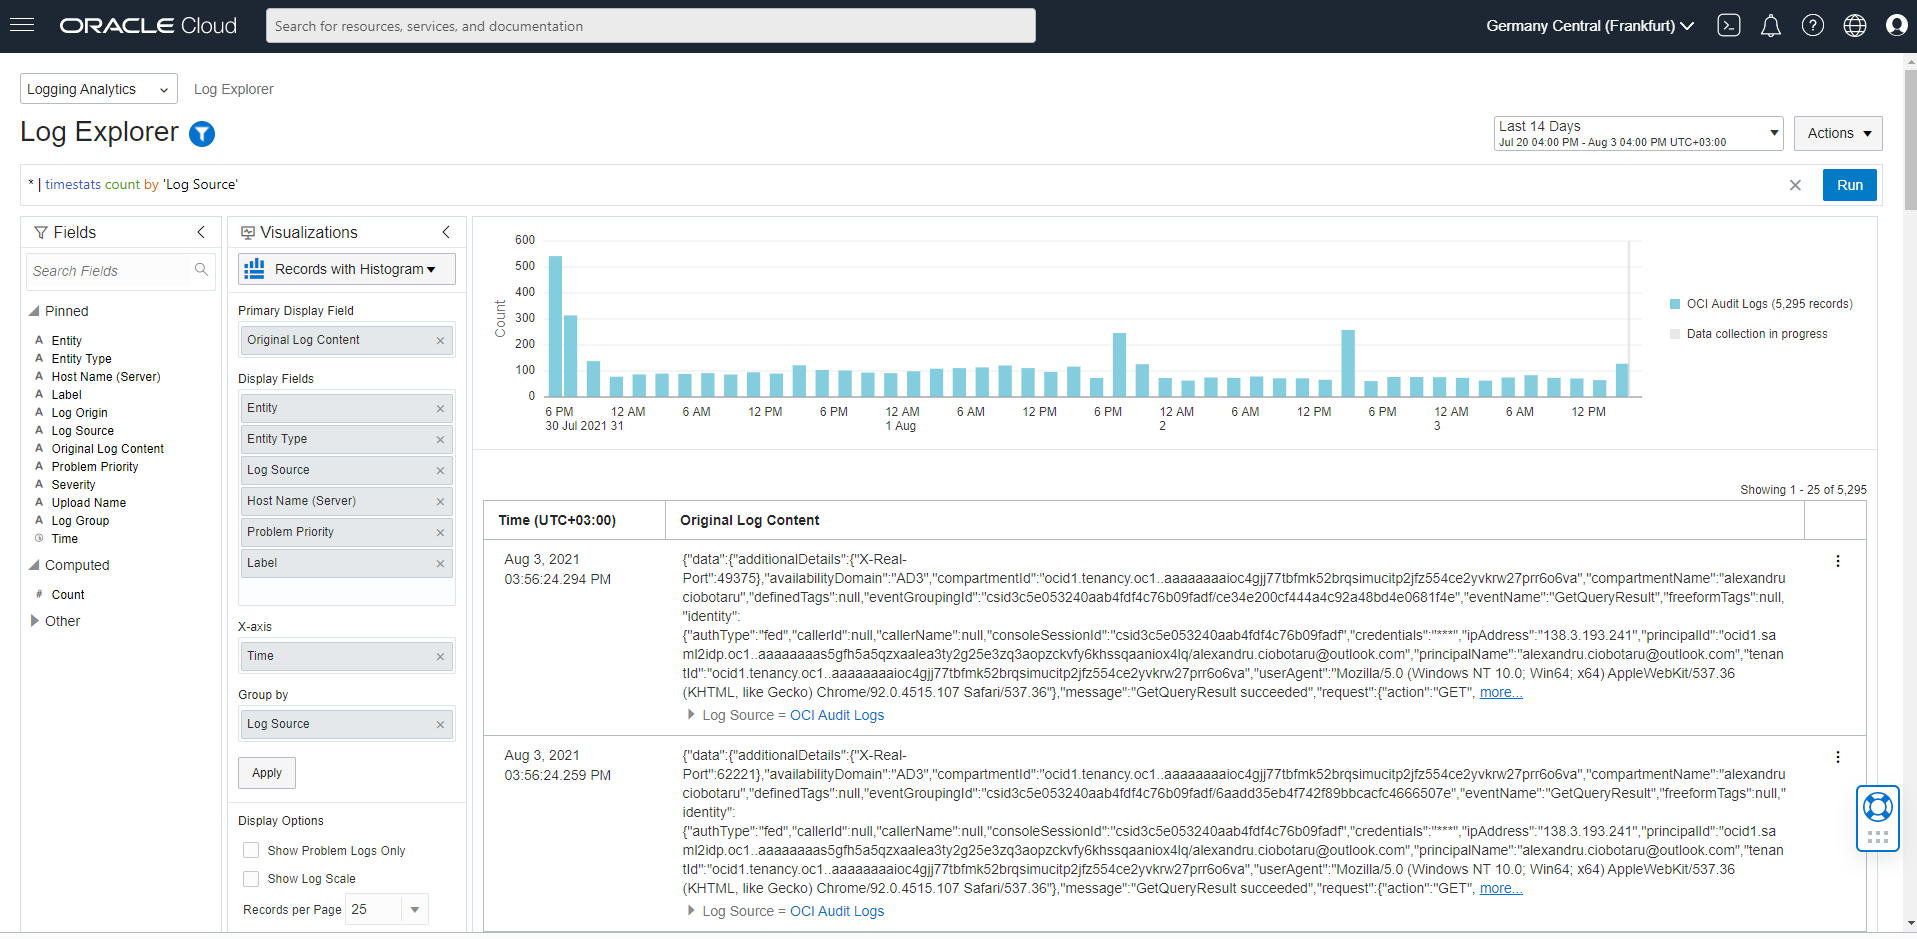
Description of the illustration 24
-
* | cluster
This query clusters log events by the shape of the log records and analyzes large data sets in a structured way.
Sample Output:
Description of the illustration 25
Learn More
- Log Analytics Technical Content
- Create custom dashboards: Create Dashboards
- Other methods of ingesting logs: Ingest Logs
- Build more complex queries: Query Search
- Log Analytics API
- Log Analytics Policies Catalog
OCI Log Analytics Quick Start Guide
F35570-11
July 2025
Get started with the Oracle Cloud Infrastructure Log Analytics service using these simple step-by-step instructions.
This software and related documentation are provided under a license agreement containing restrictions on use and disclosure and are protected by intellectual property laws. Except as expressly permitted in your license agreement or allowed by law, you may not use, copy, reproduce, translate, broadcast, modify, license, transmit, distribute, exhibit, perform, publish, or display any part, in any form, or by any means. Reverse engineering, disassembly, or decompilation of this software, unless required by law for interoperability, is prohibited.
If this is software or related documentation that is delivered to the U.S. Government or anyone licensing it on behalf of the U.S. Government, then the following notice is applicable:
U.S. GOVERNMENT END USERS: Oracle programs (including any operating system, integrated software, any programs embedded, installed or activated on delivered hardware, and modifications of such programs) and Oracle computer documentation or other Oracle data delivered to or accessed by U.S. Government end users are "commercial computer software" or "commercial computer software documentation" pursuant to the applicable Federal Acquisition Regulation and agency-specific supplemental regulations. As such, the use, reproduction, duplication, release, display, disclosure, modification, preparation of derivative works, and/or adaptation of i) Oracle programs (including any operating system, integrated software, any programs embedded, installed or activated on delivered hardware, and modifications of such programs), ii) Oracle computer documentation and/or iii) other Oracle data, is subject to the rights and limitations specified in the license contained in the applicable contract. The terms governing the U.S. Government's use of Oracle cloud services are defined by the applicable contract for such services. No other rights are granted to the U.S. Government.
This software or hardware is developed for general use in a variety of information management applications. It is not developed or intended for use in any inherently dangerous applications, including applications that may create a risk of personal injury. If you use this software or hardware in dangerous applications, then you shall be responsible to take all appropriate fail-safe, backup, redundancy, and other measures to ensure its safe use. Oracle Corporation and its affiliates disclaim any liability for any damages caused by use of this software or hardware in dangerous applications.
Oracle and Java are registered trademarks of Oracle and/or its affiliates. Other names may be trademarks of their respective owners.
Intel and Intel Inside are trademarks or registered trademarks of Intel Corporation. All SPARC trademarks are used under license and are trademarks or registered trademarks of SPARC International, Inc. AMD, Epyc, and the AMD logo are trademarks or registered trademarks of Advanced Micro Devices. UNIX is a registered trademark of The Open Group.
This software or hardware and documentation may provide access to or information about content, products, and services from third parties. Oracle Corporation and its affiliates are not responsible for and expressly disclaim all warranties of any kind with respect to third-party content, products, and services unless otherwise set forth in an applicable agreement between you and Oracle. Oracle Corporation and its affiliates will not be responsible for any loss, costs, or damages incurred due to your access to or use of third-party content, products, or services, except as set forth in an applicable agreement between you and Oracle.