Monitor End User Experience
Monitoring the experience of end users of today’s applications involves closely watching various aspects of an application, including monitoring of page performance, monitoring of AJAX requests, and monitoring of application request performance.
Let’s consider an example of a RideShare application. As a DevOps administrator, you need to monitor the performance of:
-
The page
cart.jsp,the page where the orders are completed. -
The AJAX call checkout, the request that will be called by the page
cart.jsp. -
The application request checkout that is associated with the page
cart.jsp.
Monitor Page Performance
Your customers access web pages in your application, and they expect superior performance. Slow page loads, high page response times, failed transactions frustrate your application users. As the DevOps administrator, you need tools to monitor page performance and get deep visibility into all web pages, transactions, and so on. Oracle Application Performance Monitoring also enables you to track errors that affect page performance.
If the page you are looking for is not among the top five:
- In the left pane, click Pages to see a list of Pages.
- Click the name of a page to view the page details.
-
In the above example, the page
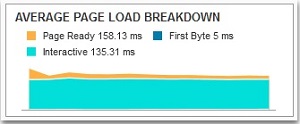
cart.jspstarted its loading with the first byte at 5 milliseconds, and the page became interactive at 135 milliseconds. The page was completely loaded and ready for customer input at 158 milliseconds, and this is probably an issue because the page load time is high. -
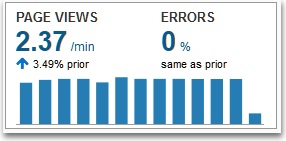
The page was viewed more than 400 times.
-
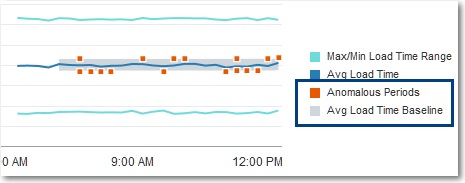
Check the Anomalous Periods and Average Load Time Baseline options to view the baseline and anomalies on the average load time and for page views. The anomalies are depicted as spots above and below the baseline.
To improve grouping of pages, and to enhance the ability to identify performance issues, patterns in URLs that are related to unique numeric identifiers will be replaced by the character '*'.
Example: The URLs http://www.oracle.com/01234/page and http://www.oracle.com/12345/page both will be reported as http://www.oracle.com/*/page.
Monitor Ajax Calls
As the DevOps administrator, your goal is to improve and accelerate the performance of your applications. End users don’t know what causes slow performance, but you need more visibility into several aspects of your application that affect end-user experience. Oracle Application Performance Monitoring enables you to track Ajax errors in your application. Poor performance of Ajax requests affects the experience of your end users, and it reflects poorly on your website. You should monitor Ajax interactions of web pages in your application, so you can find out and resolve issues.
- In the left pane, click Pages to see a list of Pages.
- Click the name of a page to view the page details.
- Select the Ajax Calls tab and click a call to view its details.
Alternatively, you can also use the Search pane to search for a Ajax call directly.
-
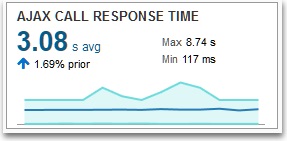
In the example here, the response time of the AJAX call checkout is very slow at over 3 seconds.

-
The response time for the call seems to be very high, and this is a concern. In the graphs, you can see that the call response time peaked to 2.18 seconds at 12.00 AM.
-

The Successful Calls graph shows the number of successful calls that were encountered through the selected time period.
Check the Anomalous Periods and Calls Baseline options to view the baseline and anomalies on successful calls. The anomalies are depicted as spots above and below the baseline. You can also see the baseline and anomalies for Ajax Call Response Time.
To improve grouping of Ajax Calls, and to enhance the ability to identify performance issues, patterns in URLs that are related to unique numeric identifiers will be replaced by the character '*'.
Example: The URLs http://www.oracle.com/01234/page and http://www.oracle.com/12345/page both will be reported as http://www.oracle.com/*/page.
Ajax calls with the same URLs are grouped and can be seen from the Server Requests page. When the same Ajax call is served by different application servers, these will show-up as different server requests. This allows you to compare different application servers handling the same server requests.
Monitor End User Experience through Sessions
Oracle Application Performance Monitoring enables monitoring of end user experience by providing data on user sessions.
The sessions page gives a quick view of the status of every user session. You can sort the sessions based on their health or number of errors, to see sessions with possible issues on top of the list.
You can also see an aggregate view on sessions by location by clicking the Graph icon. This functionality also offers slice options by creating your own filters and can help you identify relevant sessions for further diagnosing.
To view a user session:

