Monitor Server Request Performance

You must monitor HTTP requests to see how your application behaves as load varies. Clients, such as browsers used by your application users, perform various operations on your application resources and objects. Using Oracle Application Performance Monitoring, you can assess server-side performance down to the operation and method level. You can view and monitor application requests linked across servers. This level of detail helps you understand how clients access your application, and you can take action to improve end-user experience.

In the Oracle Application Performance Monitoring home page, the Server Request tile displays the top five server requests. Click the server request that you want to view details about. If the server request you are looking for is not among the top five:
  1. In the left pane, click Server Requests to see a list of server requests.
  2. Click the name of a server request to view details of the server request.
    In the Diagram tab, see a pictorial representation of the calls made by the server request. You can see how many calls the request has received, how many internal and external calls it has made and if there are any errors in any of these calls. Hover over the objects in the diagram to view details in the Tooltip pane.
  3. Click Metrics to view further details of the server request.

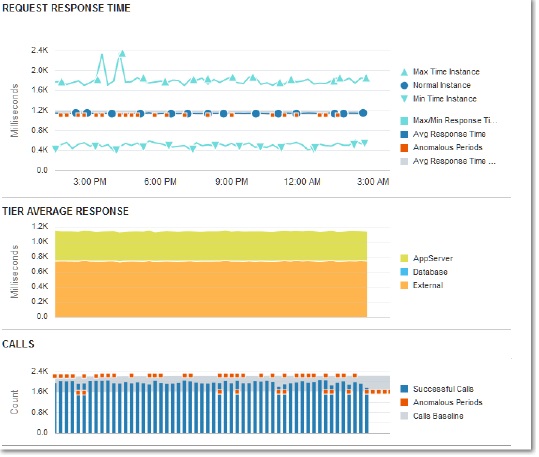
    Use the Anomalies legend to turn on/off the information about anomalies and baselines. You can also turn off other elements like Maximum Time and Minimum Time to simplify your view.

    Server request details

    • In the above example, the response time of the server request is highest at over 2 seconds, twice between 3 and 6 pm.

    • The average response time of the external tier seems to be the highest among the three tiers.

    • Check the Anomalous Periods and Average Response Time Baseline options to view the baseline and anomalies on request response time. The anomalies are depicted as spots above and below the baseline. You can also see the baseline and anomalies for Successful Calls.

  4. Select the Links tab to view all the links related to the request.

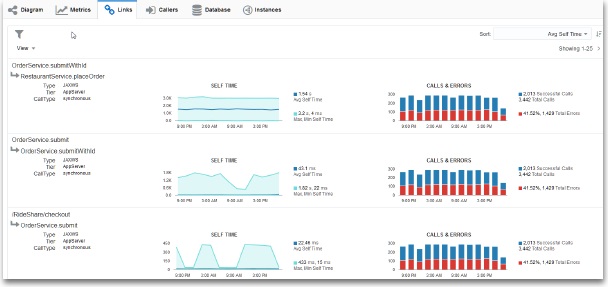
    The Links tab links all application requests across servers. The tab also lists the callers of the server request, as well as the operation invocations made within the server request. If the server request makes external calls to other server requests, the user can click the other server request to navigate to its details.

    Links tab

View Metrics for a Group of Server Requests

You can view combined metrics for a group of related Server Requests.

Related Server Requests are grouped together into Logical Server Requests or LSRs, and you can view metrics for all these server requests together. LSRs are based on a unique combination of these 3 values — Server request start operation time, Deployment Time, and Genre Type. LSRs are available on applications created with the criterion AppServers with Classifications.
  1. In the left navigation pane, select Applications to view a list of Applications.
    For each application listed, you can see the criteria of the application definition.
  2. Click the name of the application you want to access or view more details for. The application details page is displayed.
    If this application was defined by AppServers with Classifications, you can view its LSR metrics.
  3. In the left navigation pane, select Logical Server Requests. All the Server Requests based on your definition are listed here, irrespective of applications.
  4. Click the name of the LSR you want to view details for.

    The Metrics tab displays details like Request Response Time, Tier Average Response and Call details. The Server Requests tab lists all associated server requests. You can drill down to view further details of the server requests.