Analyze Exadata Systems with the Integrated View of Logs and Analytics
Oracle Management Cloud application provides a single, unified view of the different types of Exadata systems (Exadata Database Macine, Exadata CS and Exadata CC) across your enterprise. You can use the data analytics information from this view to identify current resource constraints and workloads to forecast your future resource requirements. You can also track down problems and resolve them quickly.
Note:
This dashboard data assumes that your Exadata systems databases are managed by Oracle Enterprise Manager and data is made available to Oracle Management Cloud by using a Data Collector along with a management cloud agent. See Tasks 2 and 3 in Perform the Prerequisite Tasks for details on installing a data collector and a cloud agent.To get a unified view of your enterprise-wide resource utilization and performance of Exadata Database Machine, Exadata CS and Exadata CC systems, on the Oracle Management Cloud home page, click the OMC Navigation Menu on the top-left corner, and then click Exadata. All aspects of monitoring (from Oracle Infrastructure Monitoring), logs (from Oracle Log Analytics) for troubleshooting, and performance analytics (from Database Performance Analytics) are integrated to provide this unified view.
The Overview page displays data for all Exadata systems. In addition, resource utilization and performance analytics is available for Exadata systems with Enterprise edition license type (that is, these Exadata systems are ITA enabled).
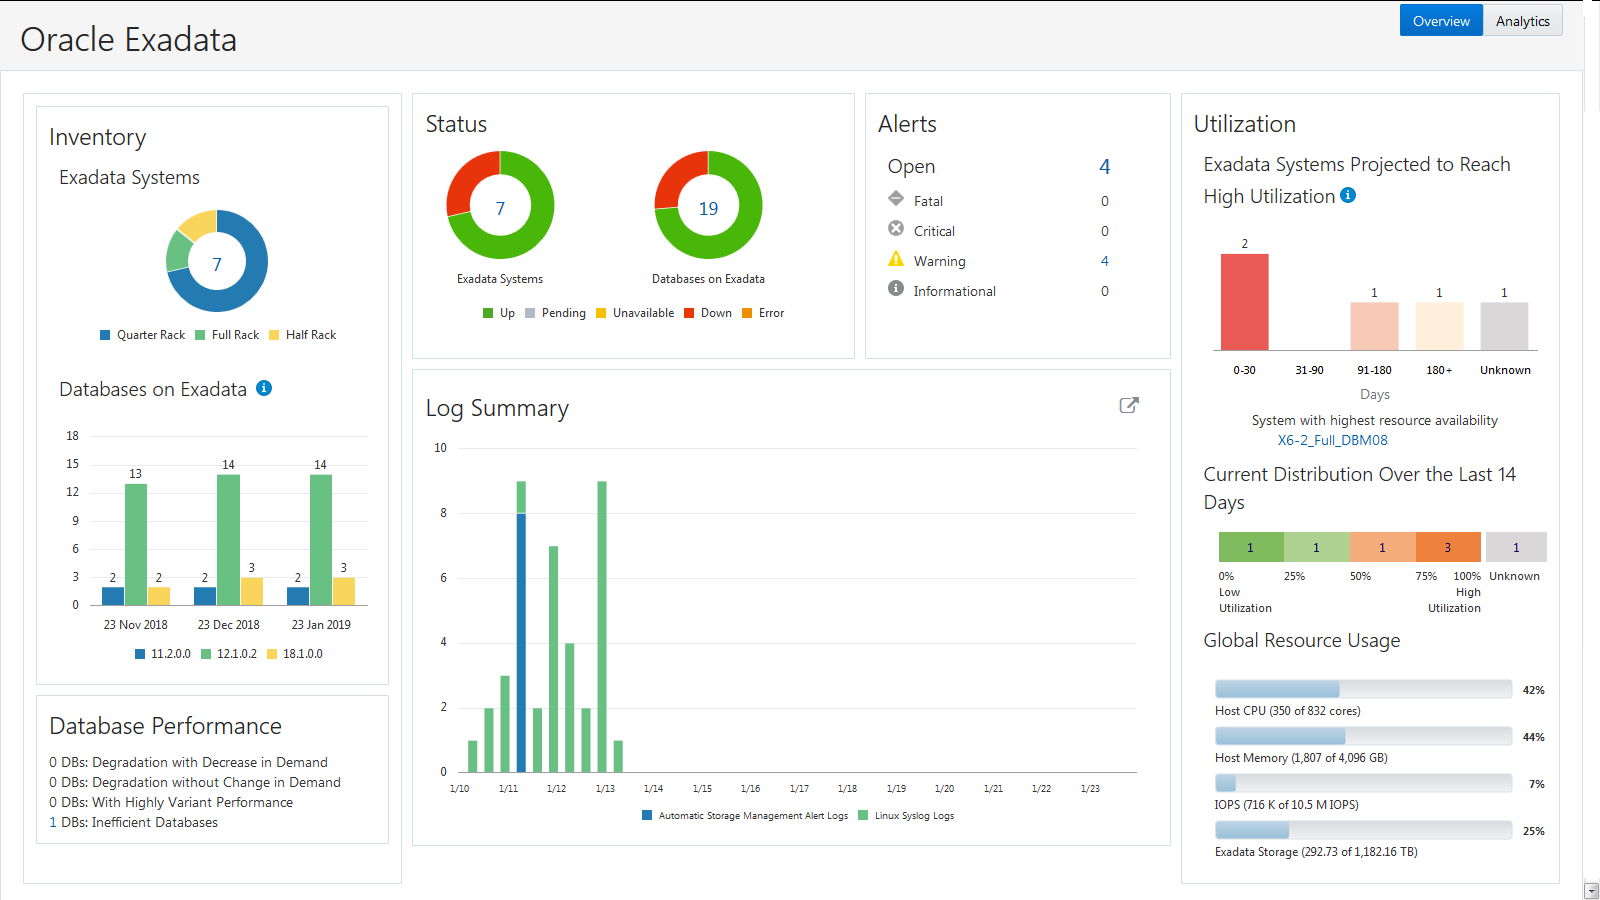
The unified view provides the following information:
- The categorization of the different Exadata systems based on type: Exadata Database Machine, Exadata CS and Exadata CC.
- The categorization of the different Exadata type systems across your enterprise, based on the rack type.
- The number of databases (including their version numbers) associated with Exadata systems for the past three months.
- Performance of your databases by listing the databases with performance degradation, databases with varying workload performance, and inefficient databases. You can drill down to further analyze the performance of these databases using the Database Performance Analytics application of Oracle IT Analytics.
- The status of each Exadata system along with the status of databases on these systems.
- The list of all open alerts grouped by their severity.
- The systems (with Enterprise edition license type) expected to reach high utilization in the next 30, 90, 180, and 180+ days. Based on the actual usage of critical resources such as CPU, memory, IOPS, and storage over a period of time, ITA forecasts when these resources will reach their defined utilization threshold values (that you set in the IT Analytics Settings page) in the future.
- The number of Exadata systems running with 0–25%, 25– 50%, 50–75%, and 75–100% utilization of resources for the last 14 days. This categorization is based on the utilization of host CPU, host memory, IPOS, and Exadata storage.
- Summary of logs grouped by log source.
- The global resource usage for all Exadata systems independent of type (Exadata Database Machine, Exadata CS and Exadata CC) in terms of host CPU, host memory, IOPS, and Exadata storage.
Figure 3-18 Exadata Analytics Dashboard

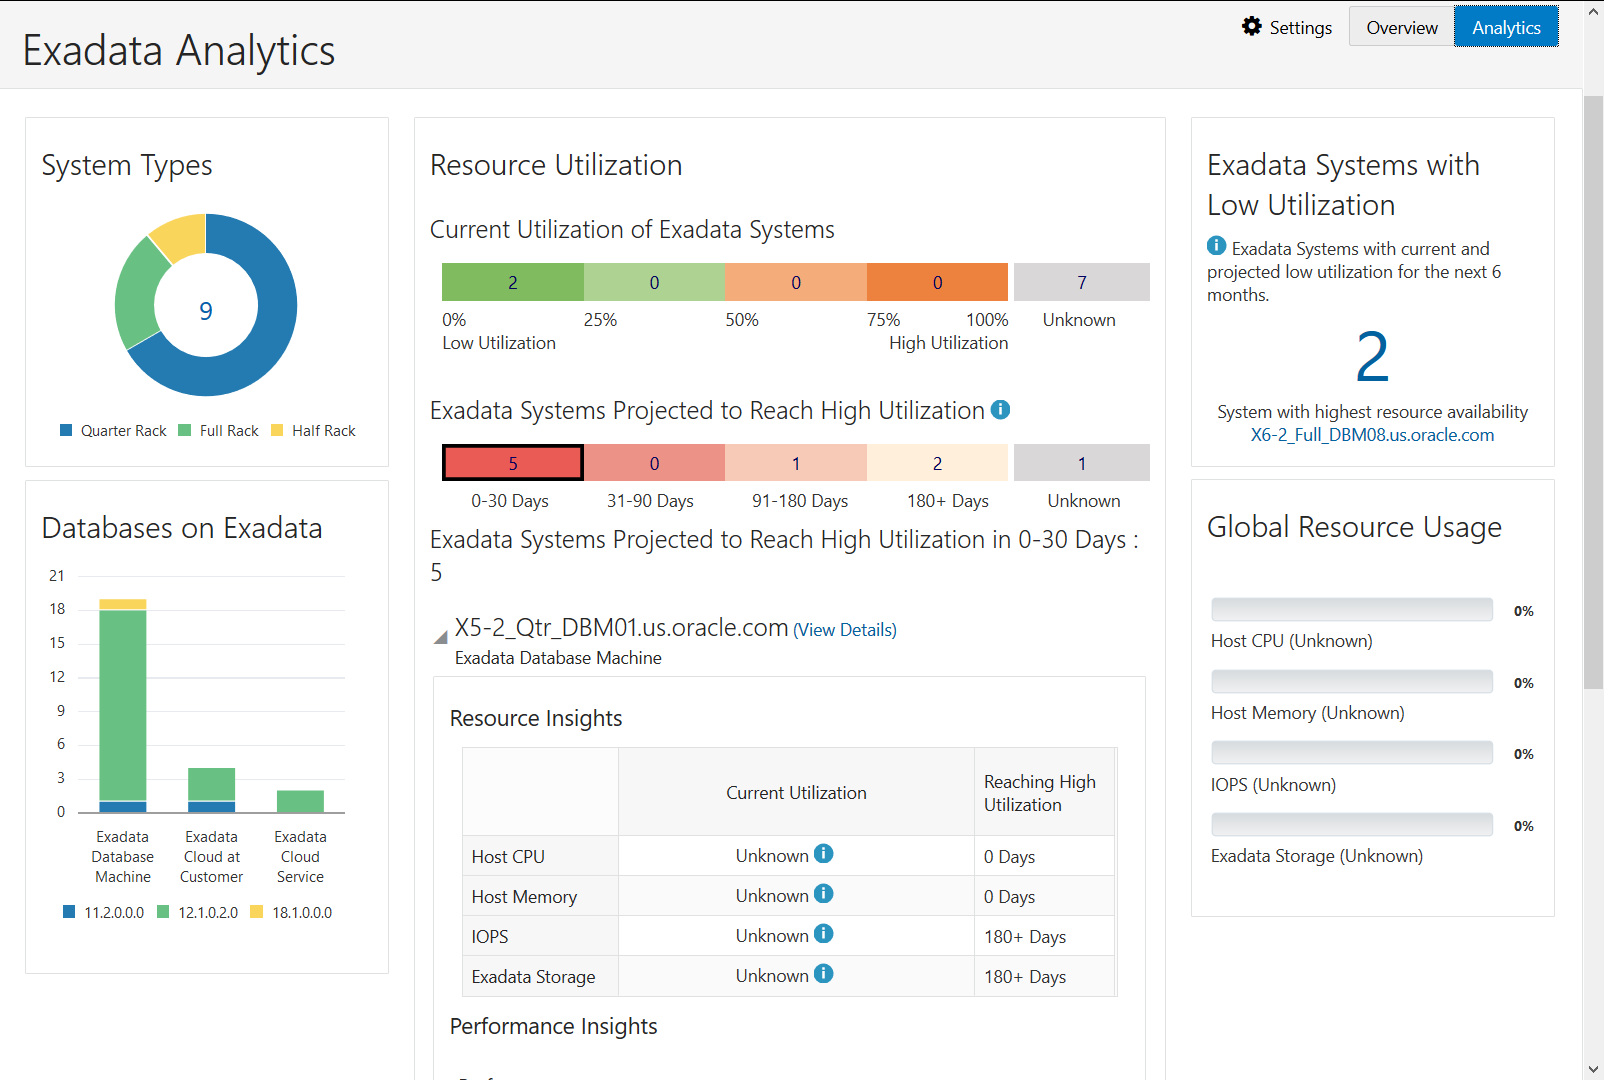
The Analytics page displays data for all on-premise and cloud Exadata systems. These include:
- A breakdown of system types in a circular graph by Quarter Rack, Full Rack and Half Rack.
- Databases categorized by Exadata system (Exadata Database Machine, Exadata CC, Exadata CS), and by database version.
- The number of Exadata systems running with 0–25%, 25– 50%, 50–75%, and 75–100% utilization of resources for the last 14 days. This categorization is based on the utilization of host CPU, host memory, IPOS, and Exadata storage.
- The number of Exadata systems projected to reach a high utilization in the next 30 days. This categorization is based on the utilization of host CPU, host memory, IPOS, and Exadata storage.
- The global resource usage for all Exadata systems independent of type (Exadata Database Machine, Exadata CS and Exadata CC) in terms of host CPU, host memory, IOPS, and Exadata storage.
