Monitor the Processes from the UI
Once you've mapped your Process Set to a host, you can monitor metrics for the host processes from the host entity homepage.
On the host homepage, Process Set metrics appear in the Performance Tables and Performance Charts tabs.
Performance Tables Tab
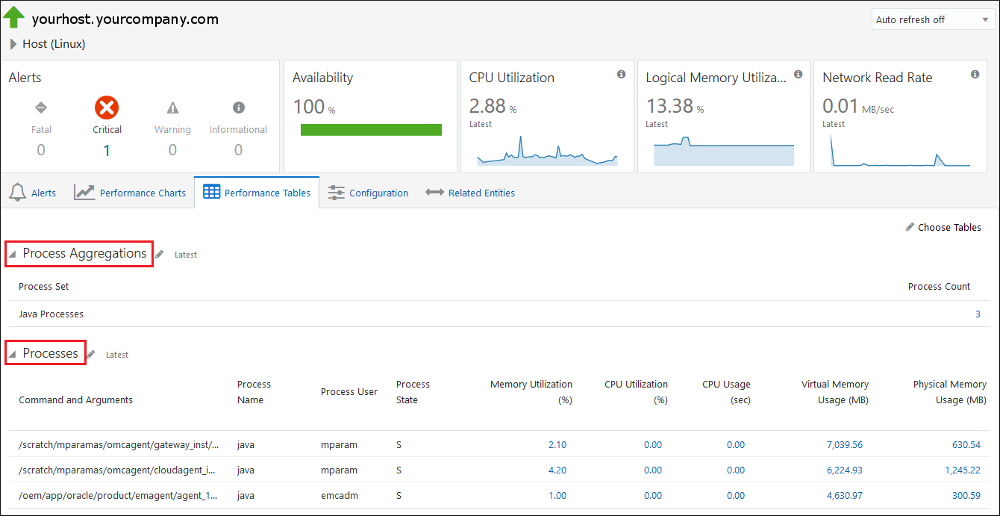
In the Performance Tables tab, performance set metrics appear under two metric groups:
- Process Aggregations: Running count of processes defined in the Process Set.
- Processes: State, CPU, Memory usage of each process matching the filter expression defined in the Process Set.
Figure 6-1 Performance Tables

Description of "Figure 6-1 Performance Tables"
Process States
The current state of a process is shown in the Process State column. Possible state values are shown in the following table.
| State | Description |
|---|---|
| D | Uninterruptible sleep (usually IO) |
| R | Running or runnable (on run queue) |
| S | Interruptible sleep (waiting for an event to complete) |
| T | Stopped, either by a job control signal or because it is being traced. |
| W | Paging (not valid since the 2.6.xx kernel) |
| X | Dead |
| Z | Defunct ("zombie") process, terminated but not reaped by its parent. |
Performance Charts Tab
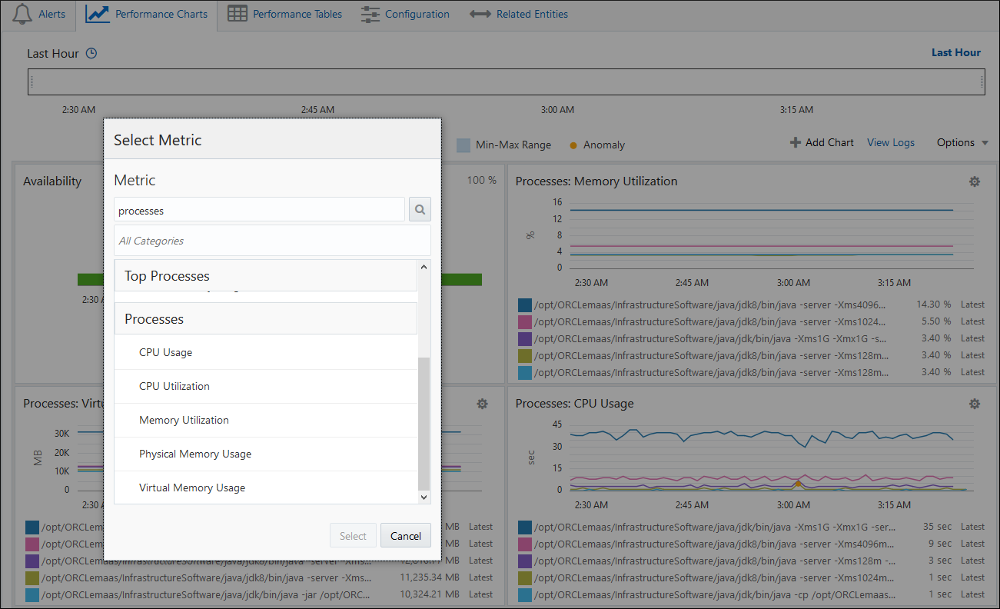
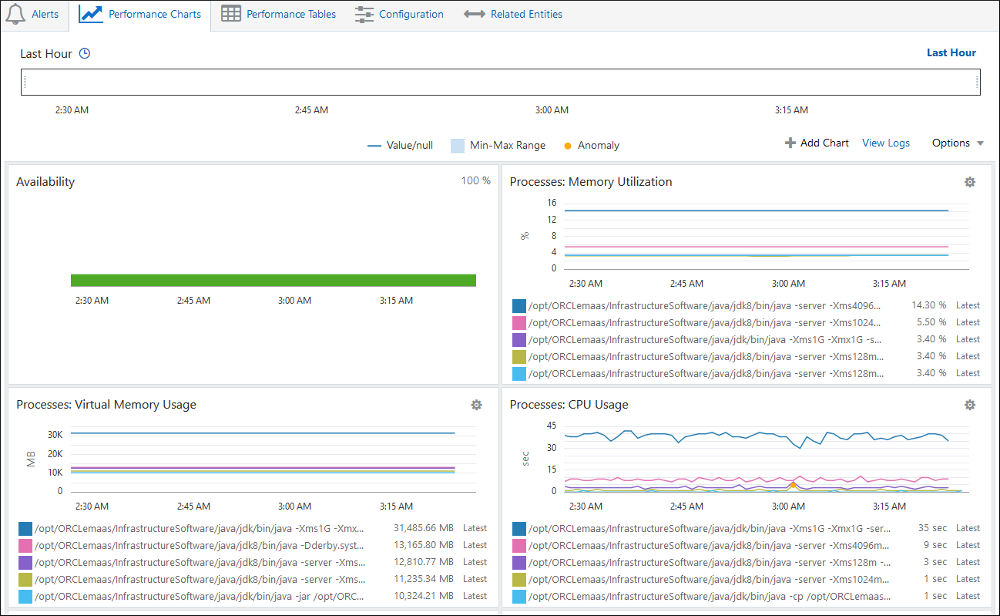
You can add any of the process metrics such as CPU Usage, CPU Utilization, Memory Utilization, etc. to the Performance tab. When adding a chart, you can type "process" into the search field to display the process metrics. Once added, the chart will show the processes with the highest value of the metric chosen. For example, if you chose CPU Usage, it will show you the top five processes in the Process Set with the highest CPU Usage.
Figure 6-2 Available Performance Chart Process Metrics
Because of the potentially large number of processes, only the top five process are shown in each chart.

