Perform Security Analysis
Use OMC tools and SMA's out-of-the-box dashboards to monitor security events and perform drill-down security analysis.
| Task | More Information |
|---|---|
|
Create an alert rule to trigger notifications based on your predefined security threshold values and severity levels. |
Create a Security Alert Rule |
| Use the Visualize panel of Oracle Log Analytics to present search data in a form that helps you better understand and analyze. | Visualize Data Using Charts and Controls in Using Log Analytics |
| Clustering uses machine learning to identify the pattern of log records, and then to group the logs that have a similar pattern. | Clusters Visualization in Using Log Analytics |
| You should use the SQL queries that are used to extract the data carefully. | SQL Query Guidelines in Using Log Analytics |
| Create and customize as many security dashboards as you need. | Security Dashboards |
Customize Your Security Dashboards
Start with SMA's, out-of-the-box, default dashboards to begin with your security customization.
- Duplicate the desired (out-of-the-box) dashboard
- Personalize it
- Save it
Security Intelligence Dashboard
SMA's dashboards analyze and monitor activity events from users and assets in your organization.
Security Intelligence Dashboard
Overview
The Security Intelligence dashboard displays information from log data that has been enriched by SMA's integrated threat intelligence service. These are primarily related to web traffic but can also include other log types that contain external (routable) IP addresses, domains, FQDNs or URLs like AV/HIPS, DLP, email, SSH, etc – Enabling analysts to view all relevant information regardless of the log type or source. The service can deliver over 80 different categories, most of which cover normal web activity like personal finance, social media, dating, travel, music, etc.
This dashboard focuses on two small subsets of categories known as suspicious and malicious, which are comprised of those most useful for security analysis.
The information related to each subset resides on separate dashboard tabs, Suspicious and Malicious, which share the same format.- Suspicious tab - Focuses on domains and IPs related to: proxy, TOR, spam, adult, gambling, P2P, as well as dead or parked sites.
- Malicious tab - Focuses on domains and IPs related to: malware sites, phishing, botnets web attacks, windows exploits, and spyware. This view is further simplified by combining malware sites, windows exploits, and web attacks into a subcategory called 'Malware'. The full category names are listed in the table below.
For the full category list and category descriptions, see Appendix: Security Intelligence Reference.
Use Security Widgets to Analyze Suspicious and Malicious Activity
Analyze data across both tabs focusing on either suspicious or malicious activity
The data displayed on the Security Intelligence dashboard follows a distinct pattern, with the same widgets on both tabs, in the same order. The only difference is the focus on categories grouped as 'Suspicious' or 'Malicious' depending on the tab being viewed. General information in the first row provides a quick overview of the activity and to provide context for the rest of the widgets on the dashboard. The information gets more and more specific flowing towards a table at the bottom of the page containing individual data elements from the logs that populate the dashboard.
Triage widgets
From this top row analysts should be able to quickly triage any activity of interest and gather the overall activity level, categories that may be of concern, whether those connections are successful or now, and where in the timeline being viewed shifts in successful/denied connections may have occurred. In a glance users should be able to identify key investigation elements and have a sense of whether deeper digging is required and the priority the investigation should be given.
|
|
|
|
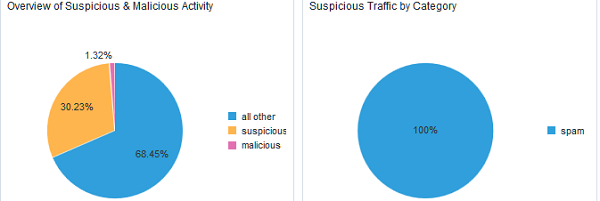
Figure 2-1 Overview of Suspicious vs Malicious Activity  |
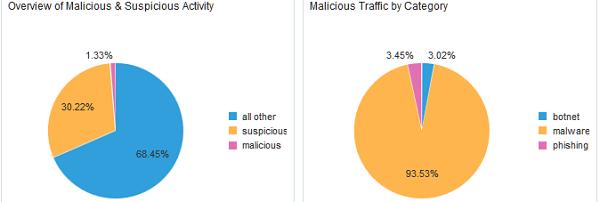
Figure 2-2 Overview of Malicious vs Suspicious Activity  |
Tiles show:
|
- The Overview of Suspicious & Malicious/Malicious & Suspicious Activity widget reveals the percentage of all logs currently being evaluated in the dashboard that are identified as Suspicious and Malicious, compared to all other logs containing an IP, Domain, or URL being categorized. This provides scale, and will be the first place to look for significant changes. Over time analysts will notice a normal range of percentages for Suspicious and Malicious categorizations seen on their network. Spikes outside this normal range are a warning sign that something may require investigating.
- The Suspicious/Malicious Traffic by Category widget displays the percentage of the logs with elements categorized as Suspicious/Malicious by category, providing a quick way to determine which specific categories of Suspicious or Malicious entities are involved in any spikes or shifts in expected levels. The specific categories involved will help analysts triage issues and prioritize their investigations. For example a spike in "dead/parked" sites seen may be an indication of an infected system beaconing to domains or IPs that are no longer active. While worth investigating this may not be as critical as a spike in other categories like Phishing or Malware which may pose a more immediate threat
|
|
|
|
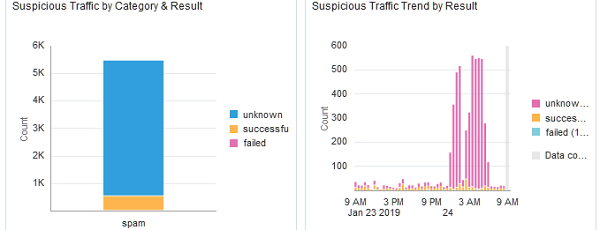
Figure 2-3 Suspicious Traffic by Category and Suspicious, and Traffic Trend by Result  |
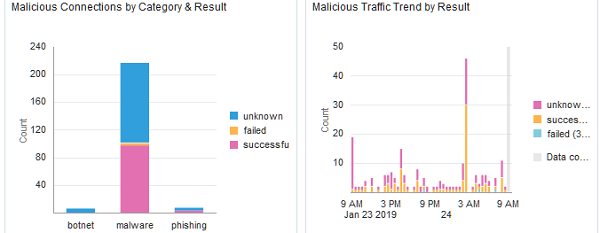
Figure 2-4 Malicious Connections by Category and Result, Malicious Traffic Trend by Result  |
Tiles show suspicious:
|
Tiles show malicious:
|
- The Suspicious/Malicious Traffic by Category & Result widget shows the percentage of each individual category that has been blocked or denied, vs those connections that were successful, or those where the relevant information isn't available in the logs. Again this information helps analysts triage spikes in activity quickly and prioritize which items require immediate attention.
- The Suspicious/Malicious Traffic Trend by Result widget illustrates the overall ratio of success/failed/unknown connections for all categories that make up the Suspicious grouping. This can assist analysts by quickly showing specific timeframes that may require deeper investigation helping to narrow the scope and amount of logs that need to be investigated.
Specific data elements widgets
From this dashboard analysts can gather all the elements they need to evaluate activity of interest and gather all the relevant information required for deeper investigation if it is warranted. These details will help narrow the search if users need to pivot to the data explorer to dig into the data further and zero in on the related activity using more advanced queries and filters.
|
|
|
|
Figure 2-5 Recent Trend by Category and Suspicious Traffic by Result  |
Figure 2-6 Trend by Malicious Category and Malicious Traffic by Result  |
Tiles show:
|
- The Recent Trend by Category widget shows the counts by individual category on a sparkline making spikes in activity related to each category easy to identify, helping to narrow the timeline of an investigation.
- The Suspicious/Malicious Traffic by Result widget provides a different view of the same data displayed in the widget above it "Suspicious/Malicious Traffic Trend by Result". Where the previous widget displayed the information on a timeline, this widget groups the counts of successful, failed or unknown traffic in groups. The size of each element shows the ratio of activity by category and result, giving analysts a better sense of the volume of each category and the number for those that were successful.
|
|
|
|
Figure 2-7 Most Frequent Suspicious and Suspicious Traffic by Top Hosts  |
Figure 2-8 Most Frequent Malicious Domains and Malicious Traffic Trend by Top Hosts  |
Tiles show:
|
- The Most Frequent Suspicious/Malicious Destination widget shows the FQDN or IPs that appear most frequently in the timeframe being viewed, their categorization, and the total count. Focusing on the FQDN or IP obfuscates differences in URLs that may prevent like activity from being clustered together.
- The Suspicious/Malicious Traffic by Top Hosts widget displays the systems that have initiated the most connections (classified as suspicious/malicious) during the timeframe being viewed. This is helpful in the triage process to help narrow down the scope of any potential investigation.
Other components not shown
- The Most Recent/Frequent Suspicious/Malicious URLs widget presents a display of the most recent URLs that have been classified as Suspicious/Malicious, providing a quick way to view web traffic of interest to determine the level of threat they represent. Viewing URLs in this way can help reveal patterns in the URLs that may be shared across multiple domains, helping analysts identify clusters of activity that may have gone unnoticed if the domains and TLDs differ significantly.
- The Suspicious/Malicious Traffic (Non-Standard TLDs) widget focuses on traffic categorized as Suspicious/Malicious related to top level domains (TLDs) outside of the initial five: com, net, org, edu, mil, and gov. This table helps surface connections that may be to TLDs that are obscure or rarely seen TLDs on an enterprise, which may warrant further investigation.
- The Suspicious/Malicious Connections table at the bottom of the dashboard reveals the Actor endpoint, Destination FQDN or IP, category, and count. This enables analysts to sort by any of these elements to cluster activity by any of these elements to further enable triage of any activity of interest.
Security Domains
| Dashboard | Overview |
|---|---|
| DNS |
Data extracted from a network’s DNS logs, providing insight into an organizations Internet traffic. Information is displayed in a variety of ways to aid in determining a baseline of normal activity, investigating trends, and identifying anomalies that may warrant deeper investigation. |
| Firewall |
Data extracted from a network’s firewall logs. This dashboard is helpful for investigating enterprise wide trends across this family of network security products. Information about denied connection attempts, ports and protocols, source and destination IP addresses and more is collected and displayed in a variety of chart types to provide insight into this layer of an enterprise’s network security. |
| Host Security |
Data extracted from SSH related logs, focusing on unsuccessful login attempts around three primary elements:
The dashboard is split into three horizontal zones. The format of each zone is consistent, allowing the three histograms to line up displaying different aspects of the same activity on the same timeline to allow analysts to better understand the attacks they face and more easily spot suspicious activity.
|
Security Databases
| Dashboard | Overview |
|---|---|
| DB2 Database |
Data extracted from a network’s DB2 database logs. Information about database accounts, schemas, data access and other aspects of an enterprise’s DB2 databases are displayed in a variety of chart types. Together these different aspects related to all the DB2 databases on the network provide insight into the activity surrounding an organization’s data. |
| MySQL Database |
Data extracted from a network’s MySQL database logs. Information about database accounts, schemas, data access and other aspects of an enterprise’s MySQL databases are displayed in a variety of chart types. Together these different aspects related to all the MySQL databases on the network provide insight into the activity surrounding an organization’s data. |
| Oracle Database |
Data extracted from a network’s Oracle database logs. Information about database accounts, schemas, data access and other aspects of an enterprise’s Oracle databases are displayed in a variety of chart types. Together these different aspects related to all the Oracle databases on the network provide insight into the activity surrounding an organization’s data. |