Siebel Trends and Analytics Dashboard
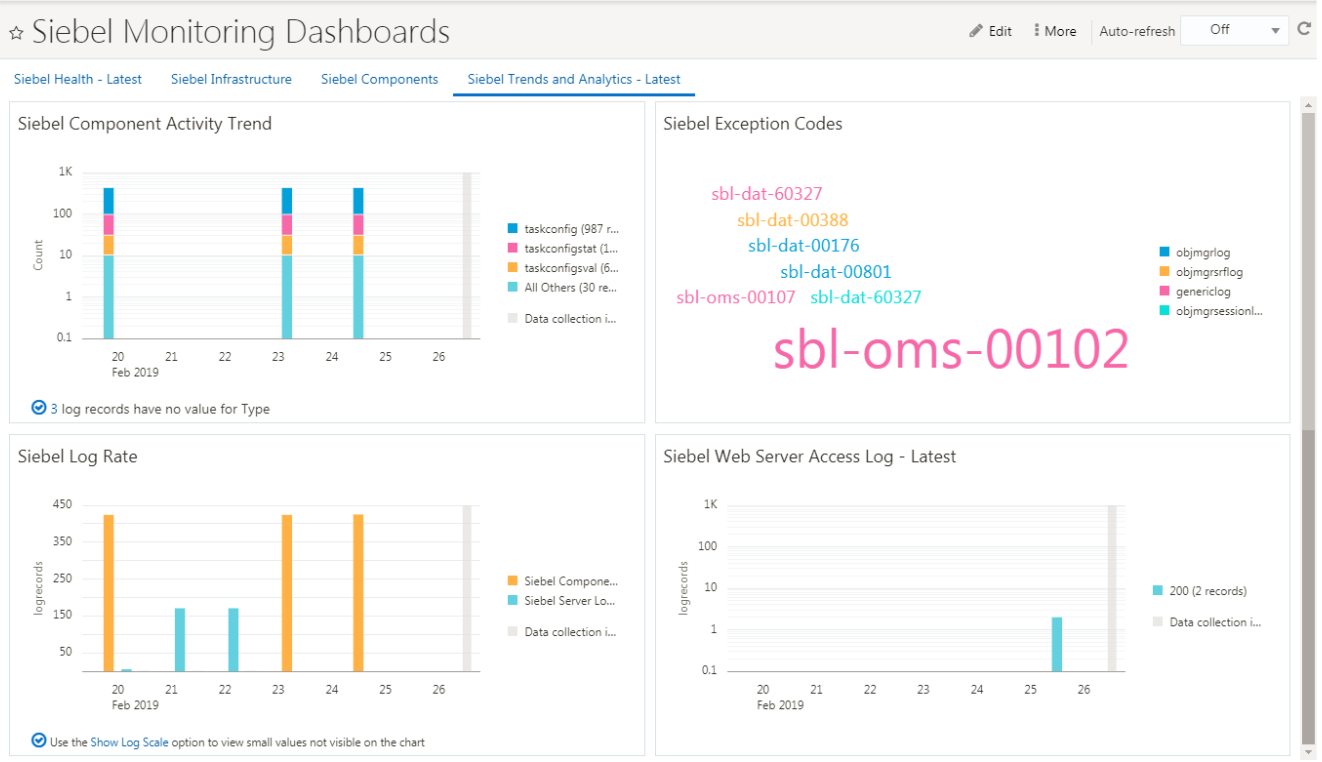
The Siebel Trends and Analytics Dashboard provides access to logs of Siebel Server and components. You can analyze the logs to derive trends for better planning. You can view the data, drill down to the specific objects, or view the information in Data Explorer.

Description of the illustration trends_analytics_dashboard.png
Here's a list of widgets and charts in the Siebel Trends and Analytics dashboard:
- Siebel Component Activity Trend widget: displays a graph of how active a specific component is, the overall status of all the Siebel components in the environment, with a percentage of components which are active and the ones that are not running. The total number of components is listed at the center of the graph. Hover over the graph to get the exact number of components that are active or are not running.
- Siebel Exception codes widget: lists the most commonly occurring error messages with indicators on how frequently these exception codes appear.
- Siebel Log Rate widget: displays a graph showing the number of log records across Siebel components and servers.
- Siebel Web Server Access Logs widget: displays the number of log records across web servers.