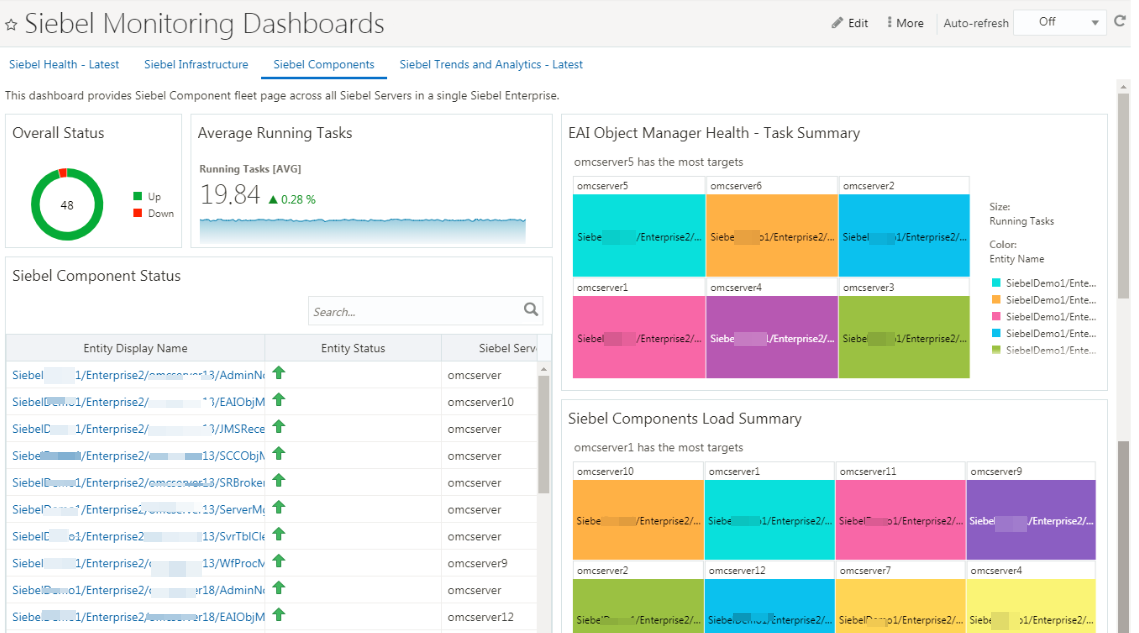
Siebel Components Dashboard
You can view the status of all the Siebel Components across your infrastructure with the Siebel Components Dashboard. You can view the data, drill down to the specific objects, or view the information in Data Explorer.

Description of the illustration components_dashboard.png
Here's a list of widgets and charts in the Siebel Components dashboard:
- Overall Status widget: displays a graph of the overall status of all the Siebel components in the environment, with a percentage of components which are active and the ones that are not running. The total number of components is listed at the center of the graph. Hover over the graph to get the exact number of components that are active or are not running.
- Average Running Tasks widget: displays the average number of tasks running per component. Hover over the widget to graphs of CPU and Memory utilization of the Siebel Server. The highest utilization numbers are highlighted at the top of the graph.
- Enterprise Application Integration (EAI) Object Manager Health widget: provides an overview of the health of the EAI Object Manager.
- Siebel Component Status widget: lists the Siebel components with their status.
- Siebel Component Load Summary widget: displays a graph of how the targets are distributed across components, and the one with most targets is listed on top of the summary. Hover over each cell in the graph to view details of the entity and its ranking.
- Top Eight Siebel Components list: the top eight Siebel components in terms of the number of tasks are listed here.