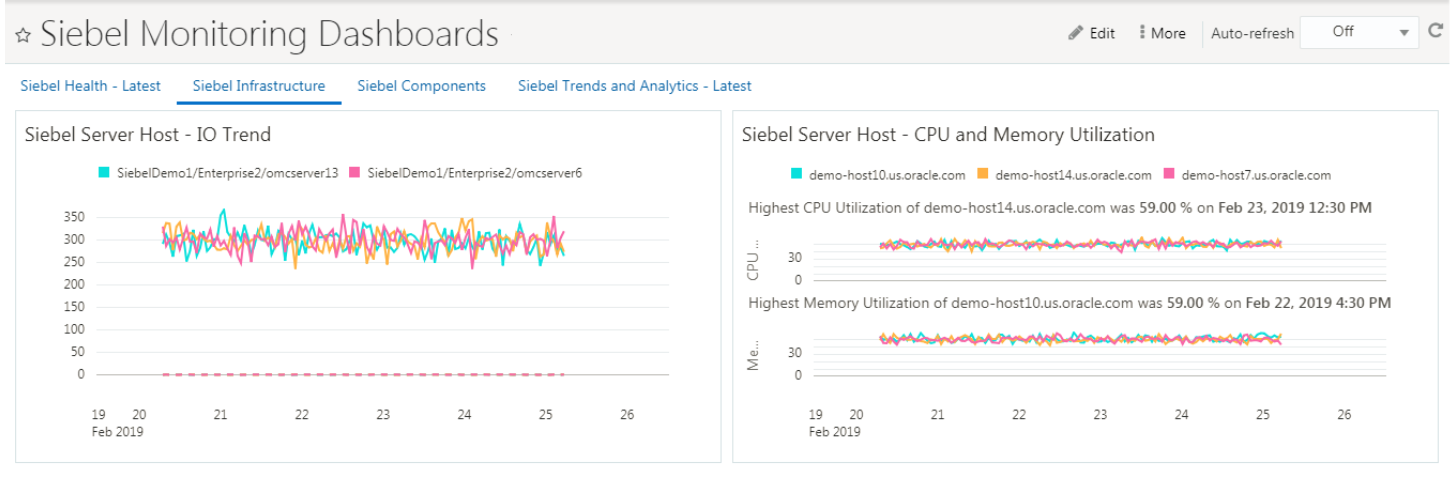
Siebel Infrastructure Dashboard
Get a detailed view of all your Siebel Infrastructure components in the Siebel Infrastructure Dashboard. You can view the data, drill down to the specific objects, or view the information in Data Explorer.

Description of the illustration infrastructure_dashboard.png
Here's a list of widgets and charts in the Siebel Infrastructure dashboard:
- Siebel Server Host IO Trend widget: Displays a graph for the Input-Output trend across the Siebel Server Host. Hover over the graph to view details of the host, and the time stamp.
- Siebel Server Host - CPU and Memory Utilization widget: Displays graphs of CPU and Memory Utilization of the Siebel Server. The highest utilization numbers are highlighted at the top of the graph.