Siebel Health Dashboard
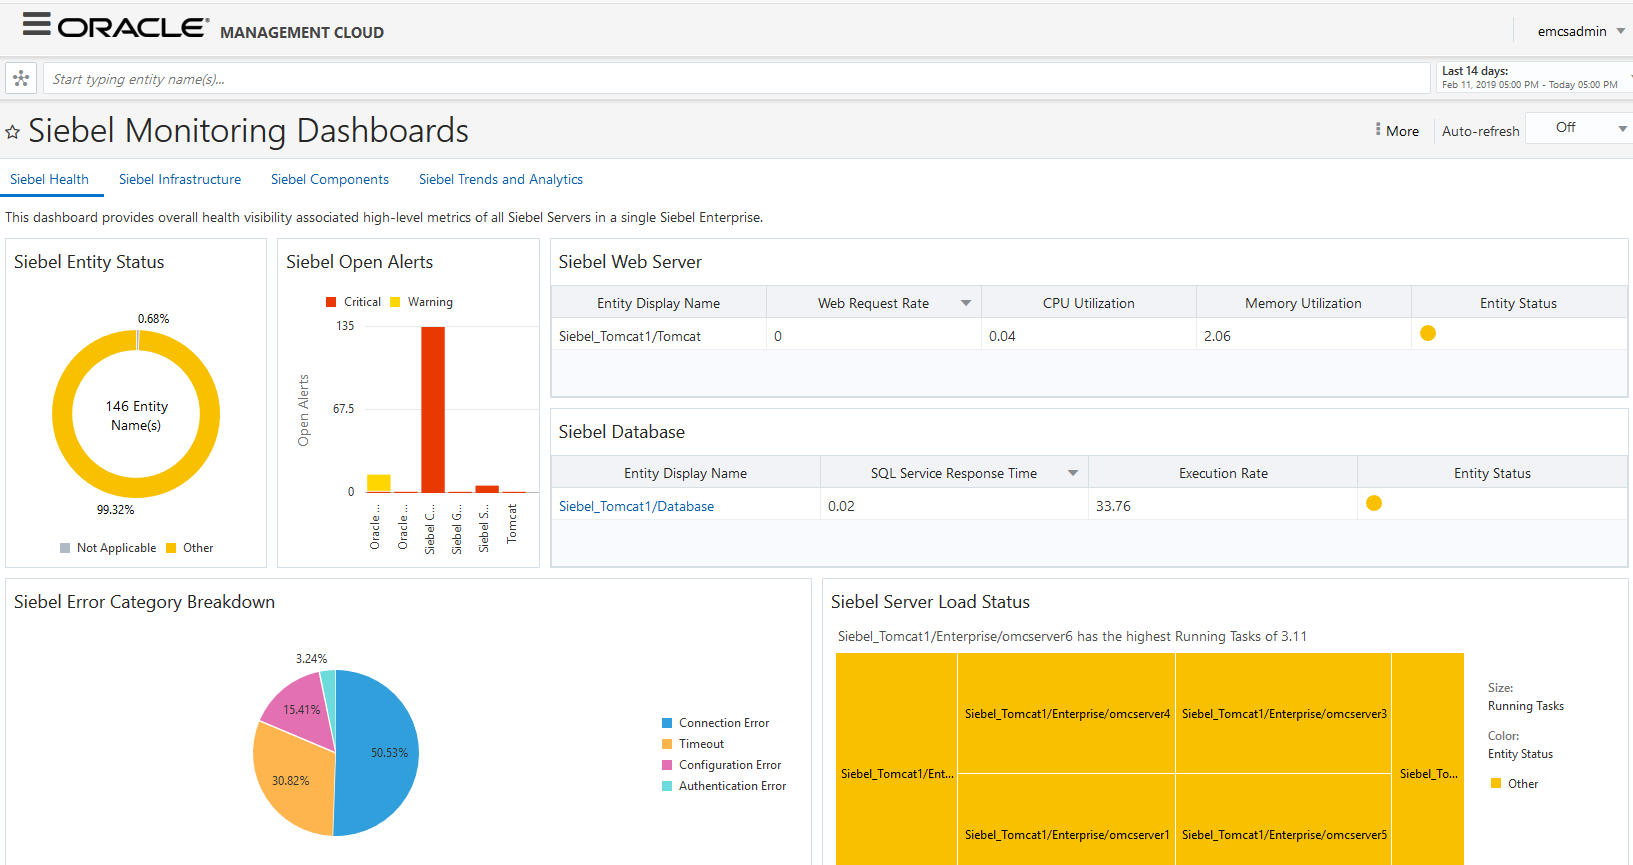
The Siebel Health dashboard provides a high level picture of all Siebel Servers within a Siebel Enterprise. You can view the data, drill down to the specific objects, or view the information in Data Explorer.

Description of the illustration health_dashboard.png
Here's a list of widgets and charts in the Siebel Health dashboard:
- Siebel Entity Status widget: Displays what percentage of your Siebel entities are running. Hover on the chart to view the number of entities that are up and the number of entities that are down.
- Siebel Open Alerts widget: Displays the number of open alerts that need your attention, divided as Warnings and Critical alerts. Hover on the chart to view the number of alerts and the entity type for which the alert is raised.
- Siebel Web Server list: Lists the web servers running currently and shows status and data on utilization of the servers.
- Siebel Database list: Provides data on the response time and execution rate of the database.
- Siebel Error Category Breakdown widget: Displays the shares of various errors. Hover on the chart to view the number of records for each error category.
- Siebel Server Load Status widget: Shows the load each of the Siebel Servers are handling.
- Siebel Web Server Web Request Processing Time widget: Provides data on time taken for web request processing by the web servers.
- Siebel Database - Response Trend widget: Displays the trends on the response times of the database.
- Workflow Process Manager - SQL Metrics Trends widget: Displays data pertaining to the workflow process manager.
- EAI Object Manager - SQL Metrics Trends widget: Displays the metrics for the Enterprise Application Integration.
- Siebel Database - Average Wait Time and Total Waits widget: Provides the average and total numbers for wait times for the database.