Using console to list tables and view table information
Learn how to use OCI console to list Oracle NoSQL Database Cloud Service tables and view the table information.
This article has the following topics:
Viewing Tables
You can view Oracle NoSQL Database Cloud Service tables from the NoSQL console.
To view tables:
-
Access the NoSQL console from the Infrastructure Console. See Accessing the Service from the Infrastructure Console .
-
You can view all the tables in your tenancy from the NoSQL console.
Viewing Table Details
Learn how to view Oracle NoSQL Database Cloud Service table details from the NoSQL console.
To view table details:
-
Access the NoSQL console from the Infrastructure Console. See Accessing the Service from the Infrastructure Console .
-
The NoSQL console lists all the tables in the tenancy.
-
A column in the list (Child tables) shows how many child tables are owned by the specified table.
-
The list of child tables for a given parent table can be viewed by selecting the Child tables tab in the parent table’s page.
-
A column in the list (Schema state) takes in one of the two values, Mutable and Frozen. The schema for a table with no replication is mutable and for a Global Active table schema is frozen (schema cannot be changed).
-
A column in the list (Global active) indicates if it is a singleton table (no replication) or a Global Active table.
-
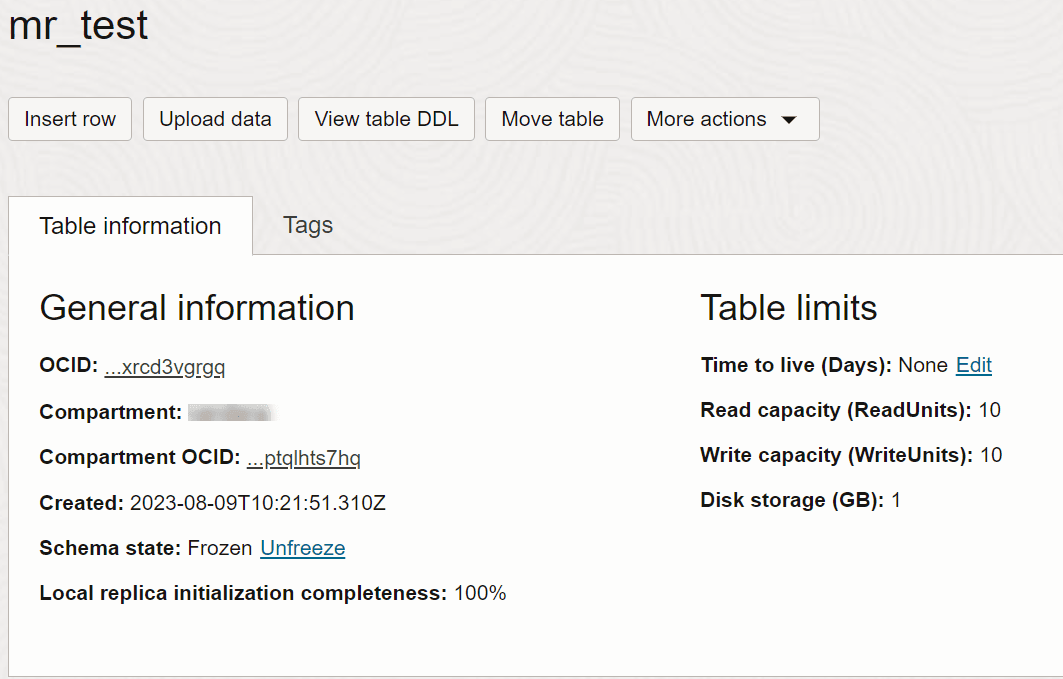
The NoSQL console lists all the tables in the tenancy. To view table details, select the table name.
The Tables page opens up.
-
You can select the different tabs to view the table details such as the table columns, indexes, and metrics.
Viewing Table DDL
Learn how to view Oracle NoSQL Database Cloud Service table DDL from the NoSQL console.
To view table DDL:
-
Access the NoSQL console from the Infrastructure Console. See Accessing the Service from the Infrastructure Console .
-
The NoSQL console lists all the tables in the tenancy.
-
In the Table Details page, click View table DDL.
The View table DDL window displays the table DDL statement.
-
Now, you can select and copy the table DDL statement from the window.
Viewing Table Columns
Learn how to view Oracle NoSQL Database Cloud Service table metrics from the NoSQL console.
To view table columns:
-
Access the NoSQL console from the Infrastructure Console. See Accessing the Service from the Infrastructure Console
-
The NoSQL console lists all the tables in the compartment.
-
Click the table name and select the Columns tab.
-
You can view the Column name with its corresponding Type.
-
You can also view whether the column can be NULL or not.
-
It also displays whether a column is assigned as Primary key or Shard key with “Yes” or “No”.
-
Note: Columns assigned as Shard key are also Primary key. To understand more about Primary and Shard key, see Primary Keys and Shard Keys
To add new columns to the table, see Altering Singleton Tables.
Viewing Table Metrics
Learn how to view Oracle NoSQL Database Cloud Service table metrics from the NoSQL console.
To view table metrics:
-
Access the NoSQL console from the Infrastructure Console. See Accessing the Service from the Infrastructure Console .
-
The NoSQL console lists all the tables in the tenancy.
-
Select the name of the table, and then select the Monitoring tab.
Table metrics such as Read units, Write units, Storage GB, Read throttle count, Write throttle count, Storage throttle count, Maximum shard usage percent, and Replica lag show up. You can filter the metrics by date, change interval, and statistic value.
-
For each of the metrics displayed on this page, you can perform the following actions:
-
View query in Metrics Explorer: This page lets you write and edit queries in Monitoring Query Language (MQL), using metrics from either your application or an Oracle Cloud Infrastructure service. If you’re not familiar with MQL, see Monitoring Query Language (MQL) Reference. To learn more about this page, see Metrics Explorer.
-
Copy chart URL: Click this option to copy the default metrics chart URL for any future reference.
-
Copy query (MQL): Click this option to copy the MQL query used to create the default metrics chart. If you’re not familiar with MQL, see Monitoring Query Language (MQL) Reference.
-
Create an alarm on this query: Click this option to create alarms to monitor your cloud resources. To learn about alarms, see Managing Alarms.
-