Understand the Graph View
In Oracle Cloud Infrastructure Process Automation, decisions are created in the graph view. In the graph view, you can create decision requirement diagrams (DRD), in accordance with DMN standards, to visually represent your decisions.
Oracle Cloud Infrastructure Process Automation currently supports one DRD per decision. The following table lists all the available DRD components, which you can use to create your decision.
| DRD Component | Description | Icons | |
|---|---|---|---|
|
Elements |
Decision |
Denotes a node that determines an output based on its inputs and the logic it contains. |
|
|
Input Data |
Denotes information used as input by one or more decision elements. |
|
|
|
Requirements |
Information Requirement |
Denotes the flow of information from an input data or a decision element to another decision element. |
|
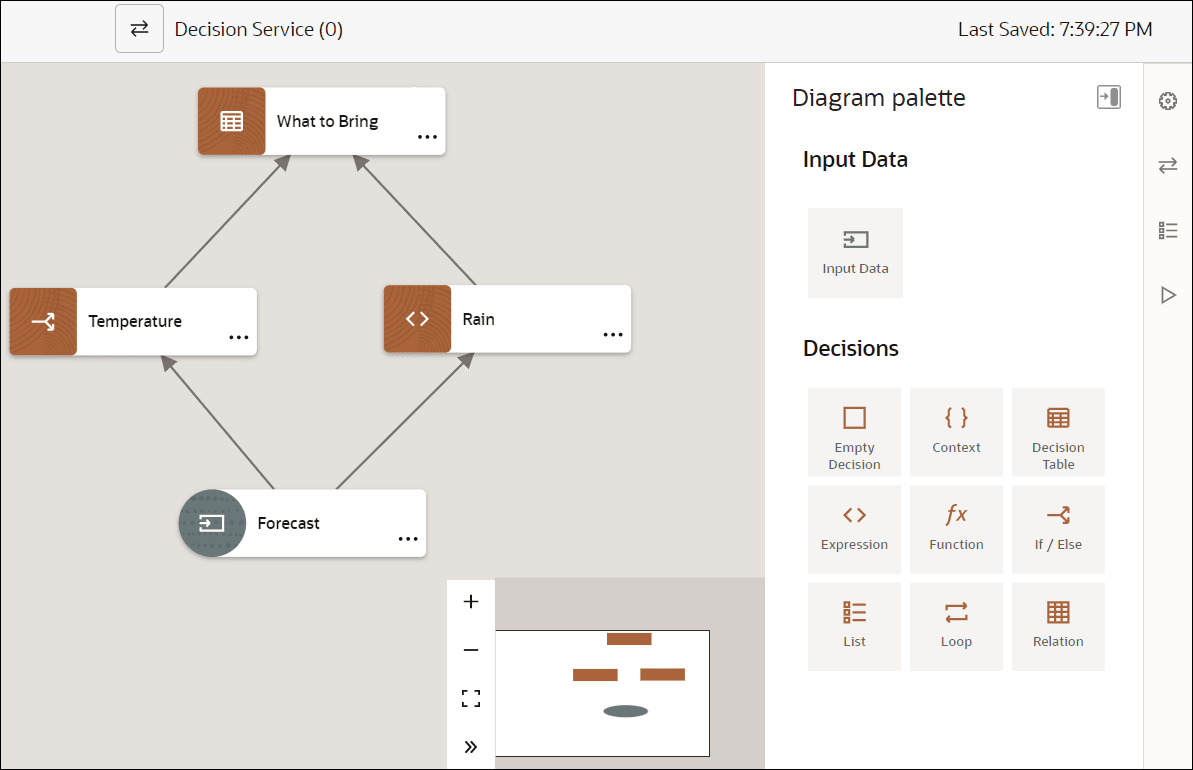
The graph view is divided into the following areas:
- Toolbar
- Canvas
- Diagram palette
Toolbar
The decision toolbar provides quick access controls to manage the decision canvas.
| Toolbar Icon | Name | Description |
|---|---|---|
|
|
Pan Mode |
Pan the entire canvas. Note that this is the default mode. |
|
|
Undo |
Revert the last action. |
|
|
Redo |
Repeat the last action. |
|
|
Maximize view | Open the editor in an expanded view. |
|
|
Minimize view |
Open the editor in a minimized view. |
|
|
Decision service |
Open the Services pane. |
Canvas
The decision canvas is the central area where you can create a diagram that represents your decision, using the elements in the diagram palette. The zoom controls at the bottom of the canvas allow you to zoom in or fit the canvas in your browser.
Diagram palette
From the diagram palette, drag and drop DRD components onto the canvas to use them in your diagram.
Under Decisions on the palette view all the decision types available for use. You can drag a particular decision type or add an empty decision element and then associate a decision notation to it.
Click ![]() to hide or view the diagram palette.
to hide or view the diagram palette.
The following figure shows a decision model in the graph view:
