About Observability
Learn about the observability services in Oracle WebLogic Server for OCI.
Logging
Oracle WebLogic Server for OCI uses the Logging Service to view the server logs such as errors or warnings in the Oracle Cloud Infrastructure console.
The logging resources, Custom Logs, Log Groups, and Unified Agent Configuration, are created during stack provisioning. See Logging Concepts in the Oracle Cloud Infrastructure documentation.
Application Performance Monitoring
Application Performance Monitoring service monitors the performance of administration and managed servers in Oracle WebLogic Server for OCI domain and displays the server metrics in the Application Performance Monitoring dashboard. It also helps to understand workloads and alerts the user for any issues in the logs.
See About Application Performance Monitoring in the Oracle Cloud Infrastructure documentation.
Application Performance Monitoring Dashboard
You can use the Oracle-defined Application Performance Monitoring (APM) dashboard for Oracle WebLogic Server for OCI to view the WebLogic metrics that are exported using APM Java Agent. This Oracle-defined Application Performance Monitoring (APM) dashboard is called WebLogic Domains.
You must access the Dashboards page to view the WebLogic Domains dashboard. To access the dashboard, see Access Dasboards.
On the Dashboards page, when you click WebLogic Domains, you can view the dashboard and the following filter options:
- Compartment - The compartment where the APM domain resides.
- APM Domain - The APM domain where your metrics is located.
- WebLogic Domain - The name of the WebLogic domain for which you can
view the metrics. This option lists all the domains of the selected APM domain.
The servers that belongs to the selected WebLogic domain are displayed in the
WebLogic Server filter.
Note:
By default, Oracle WebLogic Server for OCI supports only one domain. However, you can create additional domains. - WebLogic Server - The name of the server for which you can view the metrics. This option lists only the servers that belong to the selected WebLogic domain. But, if All servers option is selected, the widgets shows metrics for all the servers.
The WebLogic Domains dashboard page includes default widgets that can be used to monitor metrics such as CPU load, heap percentage, and stuck threads.
But, if you want to add widgets to the WebLogic Domains dashboard, you must first create a custom dashboard by creating a copy of the WebLogic Domains dashboard, and then add widgets to your newly created custom dashboard. See Customize an Oracle-defined Dashboard.
The following table lists the widgets that are available by default in the WebLogic Domains dashboard.
Table 1-1 Widgets Displayed by Default in the WebLogic Domains Dashboard
| Widget Name | Description | Type |
|---|---|---|
|
WebLogic CPU load (System and Process) |
Displays the process and system CPU load (one line per metric) for the selected server. If multiple servers are selected, the widget displays the mean of each metric of all selected servers. |
Line chart, aggregated |
|
WebLogic Free Heap percentage |
Displays the free heap percentage for the selected server. If multiple servers are selected, the widget displays the mean of the load of all selected servers. |
Line chart, aggregated |
|
WebLogic Free Heap percentage (by Server) |
Displays the free heap percentage for the selected server. If multiple servers are selected, the widget displays one line for each selected server. |
Line chart, grouped by server |
|
WebLogic Process CPU load (by Server) |
Displays the process CPU for the selected server. If multiple servers are selected, the widget displays one line for each selected server. |
Line chart, grouped by server |
|
WebLogic Stuck threads (by Server) |
Displays the stuck threads for the selected server. If multiple servers are selected, the widget displays one line for each selected server. |
Line chart, grouped by server |
|
WebLogic Queue Length (by Server) |
Displays the queue length for the selected server. If multiple servers are selected, the widget displays one line for each selected server. |
Line chart, grouped by server |
The following table lists the widgets that you can add to your newly created custom dashboard.
Table 1-2 Widgets for Your Custom Dashboard
| Widget Name | Description | Type |
|---|---|---|
|
WebLogic GC Young Time (by Server) |
Displays the garbage collection time for the young generation for the selected server. If multiple servers are selected, the widget displays one line for each selected server. |
Line chart, grouped by server |
|
WebLogic GC Old Time (by Server) |
Displays the garbage collection time for the old generation for the selected server. If multiple servers are selected, the widget displays one line for each selected server. |
Line chart, grouped by server |
|
WebLogic Servers |
Displays a table with the following information for the selected servers:
|
Table |
|
WebLogic Execute Thread Total Count (by Server) |
Displays the
|
Line chart, grouped by server |
|
WebLogic Heap Committed (by Server) |
Displays the amount of heap memory committed for the selected server. If multiple servers are selected, the widget displays one line for each selected server. |
Line chart, grouped by server |
|
WebLogic Heap Used (by Server) |
Displays the amount of heap memory used for the selected server. If multiple servers are selected, the widget displays one line for each selected server. |
Line chart, grouped by server |
|
WebLogic Threadpool |
Displays the number of stuck threads, execute thread total count and queue length (one line per metric) for the selected server. If multiple servers are selected, the widget displays the mean of each metric for all selected servers. |
Line chart, aggregated |
|
WebLogic GC Time |
Displays the garbage collection total time for young and old generation (one line per metric) for the selected server. If multiple servers are selected, the widget displays the mean of each metric for all selected servers. |
Line chart, aggregated |
|
WebLogic GC Count |
Displays the garbage collection total count for young and old generation (one line per metric) for the selected server. If multiple servers are selected, the widget displays the mean of each metric for all selected servers. |
Line chart, aggregated |
|
WebLogic Heap Usage |
Displays the amount of heap used memory and heap committed memory (one line per metric) for the selected server. If multiple servers are selected, the widget displays the mean of each metric for all selected servers. |
Line chart, aggregated |
|
WebLogic Non Heap Usage |
Displays the amount of non-heap used memory and non-heap committed memory (one line per metric) for the selected server. If multiple servers are selected, the widget displays the mean of each metric for all selected servers |
Line chart, aggregated |
|
WebLogic Last Known Status |
Displays the last known status of the selected server (e.g. Running, admin). |
SingleValue |
|
WebLogic Open Sockets |
Displays the last known value of open sockets of the selected server. |
SingleValue |
|
WebLogic Active Threads |
Displays the last known value for active threads of the
selected server, based on the formula: |
SingleValue |
Autoscaling
Oracle WebLogic Server for OCI uses autoscaling to automatically manage the size and lifecycle state of your WebLogic compute instances.
Before you enable autoscaling:
- You must create an Application Performance Monitoring domain or use an existing APM domain. See Create an APM Domain in the Oracle Cloud
Infrastructure documentation.
Note:
Application Performance Monitoring always free domain is not supported for autoscaling. - Create a new auth token for a user with access to Oracle Cloud Infrastructure Registry, or use an existing auth token. See Managing User Credentials in the Oracle Cloud Infrastructure documentation.
- Create policies for an Oracle Cloud Infrastructure user who is not an administrator. See Create Dynamic Groups and Policies for Observability.
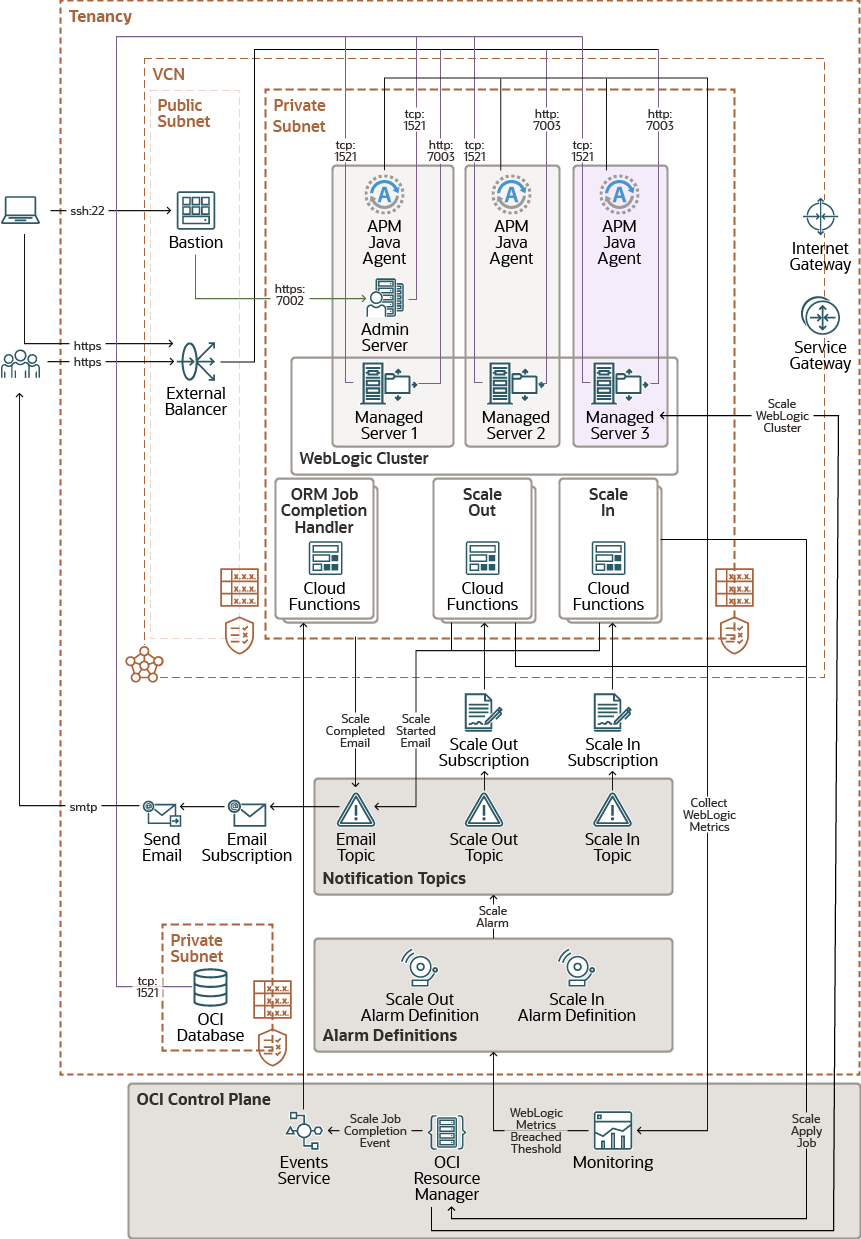
The following diagram illustrates the network configuration for autoscaling in Oracle WebLogic Server for OCI deployment.
Figure 1-2 Network Configuration

During stack creation for a domain, Oracle WebLogic Server for OCI allows you to configure metric-based autoscaling based on WebLogic Monitoring metrics.
Note:
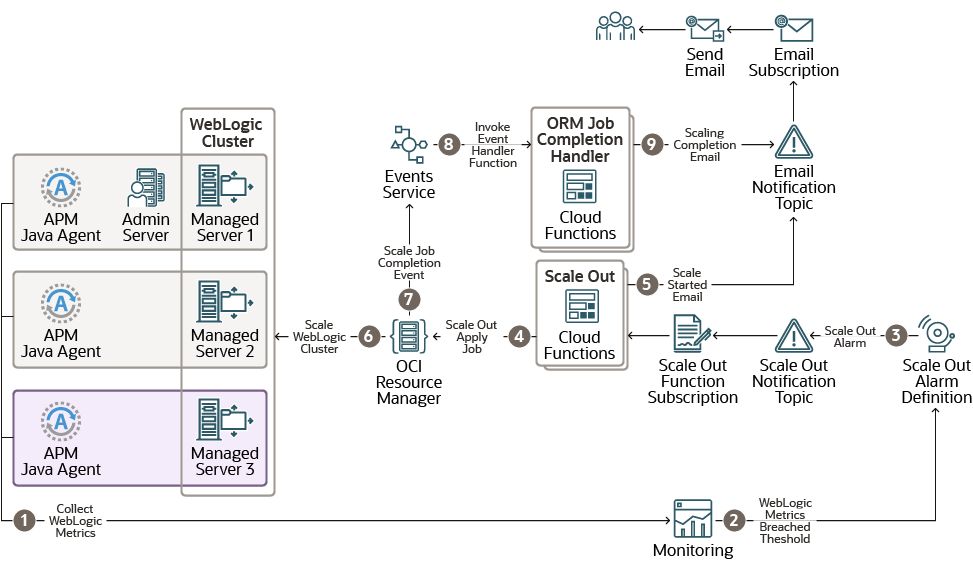
You can configure autoscaling for Oracle WebLogic Server Enterprise Edition and Oracle WebLogic Suite only.The following diagram illustrates Scale Out flow in Oracle WebLogic Server for OCI deployment.
Figure 1-3 Scale Out Flow

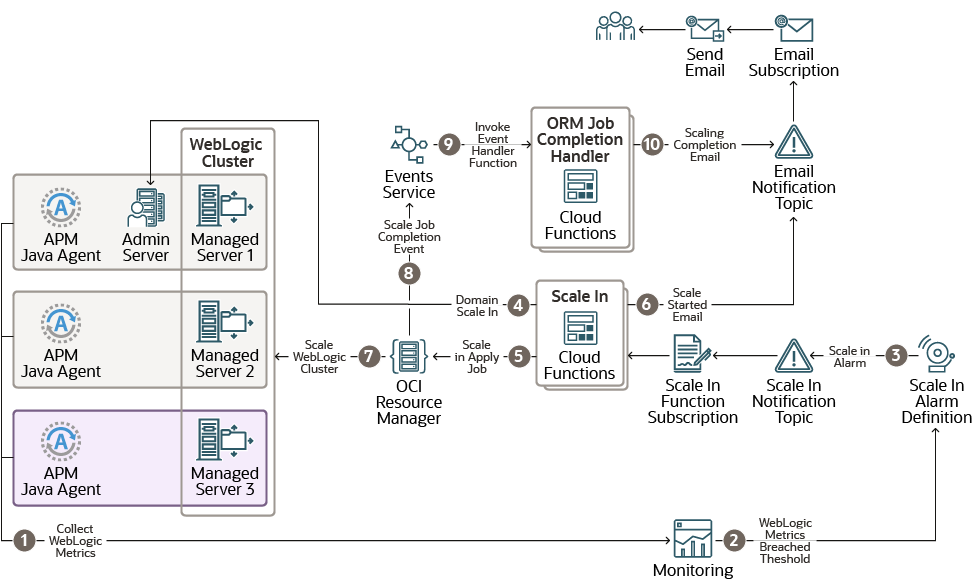
The following diagram illustrates Scale In flow in Oracle WebLogic Server for OCI deployment.
Figure 1-4 Scale In Flow

The resources created for autoscaling are:
- Application Performance Monitoring Agent - Application Performance Monitoring agent is used to collect WebLogic monitoring metrics and enables probes for tracing.
- WebLogic Monitoring metrics - WebLogic Monitoring metrics are collected by the Application Performance Monitoring Agent.
- Alarms Definition - Alarms Definitions are rules defined for
metric-based autoscaling. They include the alarm query that evaluates the alarm
using Monitoring Query Language (MQL) expression and the notification
destination to send messages when the alarm is in the firing state, in addition
to other alarm properties. See Managing Alarms in the Oracle Cloud
Infrastructure documentation.
The following Alarm Definitions are created during provisioning:
- Scale Out Alarm Definition
- Scale In Alarm Definition
If the OCI Policies check box is selected during provisioning, alarms are enabled.
If the OCI Policies check box is not selected during provisioning, alarms are disabled. You must create dynamic group and policies, and then enable alarms from the Oracle Cloud Infrastructure console post provisioning.
To create dynamic group and policies, see Create Dynamic Groups and Policies for Observability and to enable alarms, see To enable an alarm in Oracle Cloud Infrastructure documentation.
- Notification topic - A topic is a communication channel for sending
messages to its subscriptions. See Managing Topics and Subscriptions in the Oracle Cloud
Infrastructure documentation.
The following notification topics are created during provisioning:
- Scale Out Topic
- Scale In Topic
- Email Topic
- Notification subscriptions - The following notification
subscriptions are created during provisioning:
- Scale Out Function Subscription for Scale Out Topic
- Scale In Function Subscription for Scale In Topic
- Email Subscription for Email Topic
See Managing Topics and Subscriptions in the Oracle Cloud Infrastructure documentation.
- Function Application - Function Application is logical group of related functions, under which Scale In Function, Scale Out Function, and Resource Manager Job Completion Handler Function are grouped. See Overview of Functions in the Oracle Cloud Infrastructure documentation.
- Oracle Cloud Infrastructure Registry (OCIR) - OCIR is created using
Terraform in root compartment and stores the docker image of the Functions. See
Overview of Container Registry in the Oracle Cloud
Infrastructure documentation.
The following repositories are created during provisioning:
<service_prefix_name>_autoscaling_function_repo/scaleout<service_prefix_name>_autoscaling_function_repo/scalein<service_prefix_name>_autoscaling_function_repo/orm_job_completion_handler
- Functions - Functions trigger scale in and scale out operations
when an alarm event is created upon reaching a threshold for the monitored
metrics. See Overview of Functions in the Oracle Cloud
Infrastructure documentation.
The following functions are created during provisioning:
- Scale Out Function
- Scale In Function
- Resource Manager Job Completion Handler Function
- Event Rule - The Event Rule defines event matching rule for
Resource Manager
Job Create - Endevent in the stack compartment. See Overview of Events in the Oracle Cloud Infrastructure documentation. - Log Group and Logs - The log group contains one or more logs. The
log resources created during provisioning are:
- Function Application Log - This contains logs from all functions within the function application.
- Event Rule Invoke Log - This contain logs for Resource Manager Job Completion event rule invocations.
See Logging Overview in the Oracle Cloud Infrastructure documentation.
In Oracle WebLogic Server for OCI, you can apply metric-based autoscaling to WebLogic server instances. You can select a performance metric and set thresholds that this performance metric must reach to trigger an autoscaling event. The performance metrics in metric-based autoscaling are:
- CPU Load - The current CPU load of the JVM process.
- Used Heap Percent - The percentage of JVM heap that is used.
- Queue Length - The number of pending requests in the priority queue.
- Stuck Threads - The number of stuck threads in the thread pool.
See Metrics in the Oracle Cloud Infrastructure documentation.
After you select a performance metric and define the alarm minimum and maximum thresholds for the selected metric, two alarm definitions are triggered, Scale Out Alarm Definition and Scale In Alarm Definition, and a notification is sent to the Scale Out Topic or the Scale In Topic. Then, the Scale Out Function or the Scale In Function is invoked (based on the topic that receives the notification), and this function scales out or scales in the instances. Messages are sent out as emails to the notification address when the instance is scaled out or scaled in, and also after the scaling is complete with the job status.
See Notifications in the Oracle Cloud Infrastructure documentation.
The limitations with Autoscaling are:
- Autoscaling is not supported with Terraform CLI-based Oracle WebLogic Server for OCI provisioning.
- Autoscaling is not supported for cloning in this release.
- Autoscaling can be selected during provisioning only and cannot be enabled or disabled on reapply.
- Autoscaling is disabled if you select Do Not Update Domain Configuration for Scale Out during provisioning as for autoscaling, the domain update must be performed during provisioning.
- Autoscaling does not work as expected if bastion is not
configured when WebLogic instances are in private subnet.
For example, during provisioning, if you configure the bastion and you opt to manually update the domain configuration by not selecting Do Not Update Domain Configuration for Scale Out, even if the domain update fails, scale out stack apply job succeeds as it does not detect the domain update failure. So the stacks are available for autoscaling, and successive alarms trigger a scale out and thus end up scaling out to maximum node count of 30 nodes.