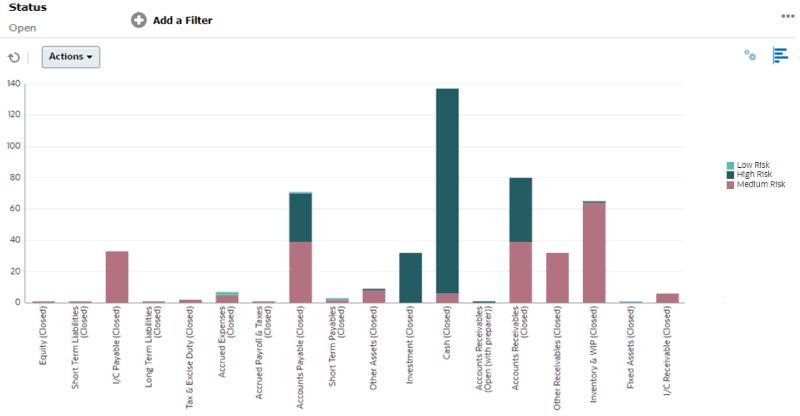
Example: Creating a Chart to Display Open Reconciliations by Account Type and Risk Rating
This example creates a chart that displays open reconciliations by Account Type, with each Account Type being further categorized based on the Risk Rating. Click any area within the chart to drill down and view of the individual records that comprise that aggregated area.

To create this chart:
- From the Home page, click Reconciliations.
- From the View Selector at the top-right of the page, select Chart View.
- Click Edit at the top-right to display the Edit Chart dialog.
- In the Properties tab, specify the following:
- In Type, select Column.
- Deselect Grid Lines.
- In Period, select Selection.
- In the Layout tab, specify the following:
- In the X Axis section:
- In Type, select Attribute.
- In Attribute 1, select Account Type.
- In Sort, select Account Type, and then Ascending.
- In the Legend (Series) section, click Add to create a row with the
following settings:
- In Value, select Reconciliation.
- In Categories, select Risk Rating.
- In the X Axis section:
- In the Axis tab, leave the default settings as is.
- In the Legend tab, specify the following:
- In Palette, select Redwood.
- In the table, set the Labels for each series as follows:
- Count: Risk Rating: High = High Risk
- Count: Risk Rating: Medium = Medium Risk
- Count: Risk Rating: Low = Low Risk
- Click OK.
- In the Filter bar, apply a filter with Status equals Open.