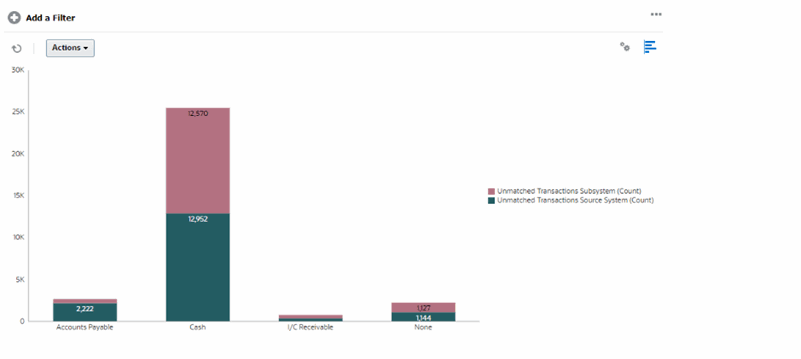
Example: Creating a Chart to Display Unmatched Transactions by Account Type
This example creates a chart that plots the total value of unmatched transactions for each account type. Click any area within the chart to drill down and view of the individual records that comprise that aggregated area.

To create this chart:
- From the Home page, click Matching.
-
From the View Selector at the top-right of the page, select Chart View.
- Click Edit at the top-right to display the Edit Chart dialog.
- In the Properties tab, specify the following:
- In Type, select Column.
- Unselect Grid Lines.
- In the Layout tab:
- In the X Axis section:
- In Type, select Attribute.
- In Attribute 1, select Account Type.
- In the Legend (Series) section, click Add to create two rows
with the following settings:
- Row 1: In Value, select Unmatched Transactions Source System (Count). In Aggregation, select Sum.
- Row 2: In Value, select Unmatched Transactions Subsystem (Count). In Aggregation, select Sum.
- In the X Axis section:
- Click OK to save the chart settings.