Setting Pivot View Layout
The Layout tab specifies how data in the pivot view must be summarized. Filters can also be applied on the data that is considered for summarizing.
Specify the following layout details:
-
In the X Axis section, specify details about the primary grouping to use in the view.
-
In Type, select one of the following: None, Attribute, Date, User, Yes/No, or True/False.
If you set the Type to Attribute, in Attribute 1, select the attribute that must be used to group data. For example, Organizational Unit.
Optionally, you can create another subgroup, within the Attribute 1 group, by selecting another attribute in Attribute 2.
-
In Sort, select the attribute and the order on which data must be sorted.
The attribute value "None" is not considered when sorting data.
- Select Swap Rows and Columns to swap the display of rows and columns in the grid.
-
-
In the Legend (Series) section, click the Add icon to create one row for each attribute for which you want to summarize data. This summary is created within the specified Type. There must be at least one row in this section.
For each row, specify the following details:
-
In Value, select the attribute whose data must be summarized. For example, Reconciliation or Alerts (Count).
-
In Aggregation, select the aggregation operation to be performed on the summarized data. It will default to the aggregation method specified on the attribute that you selected. The supported aggregation methods are Average, Count, Maximum, Minimum, and Sum.
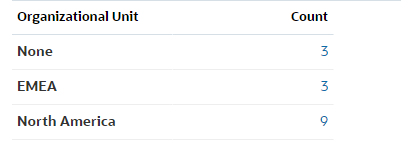
For example, if you select Attribute 1 = Organizational Unit, Value = Reconciliation, and Aggregation = Count, then one row is displayed for each organizational unit and the total number of reconciliations within each organizational unit are displayed under Count, as shown below.

Note:
If you select a non-numeric attribute in Value, the only Aggregation available is Count. -
In Categories, optionally select the attribute by which the data is summarized, within the Value group.
For example, if you select Attribute 1= Organizational Unit, Value = Reconciliation, and Aggregation = Count, and Categories = Account Type, then one row is displayed for each organization unit. The total number of profiles is displayed grouped by Account Type, as shown.

-
In Group By, select an attribute from the list. This is applicable only when Type is set to a value other than Attribute.
-
Click Filter to apply a filter on the data that is included in the pivot view. This filter is first applied on the data and then the data is summarized using the specified criteria.
By default, the first clause in a filter condition is displayed as the label for this filter.
-
- Click OK.
Considerations When Using Aggregation
The Count aggregation includes non-null values, including zero values, in the computation. The Sum and Average aggregations do not include non-null values in the computation. Therefore, keep the following points in mind when using Aggregation:
-
For a particular attribute, there may be a difference in the balance values for Count, Sum, and Average. This includes the data displayed in the chart view as well as the chart details.
-
To exclude zero values from a Count aggregation, create a filter that excludes zero values on that legend attribute.
-
For the Count aggregation, the number of details displayed when you drill down into an aggregate value may be more than the aggregated value. This is caused because the aggregation includes zero values. Note that the following types of attributes are not considered as null during aggregation operations:
- Count attributes, like Comments (Count)
- Status attributes
- Yes/No status-type attributes like Late, Ever Been Late, or Preparer (Claimed)
- Required values like Name, Task Type