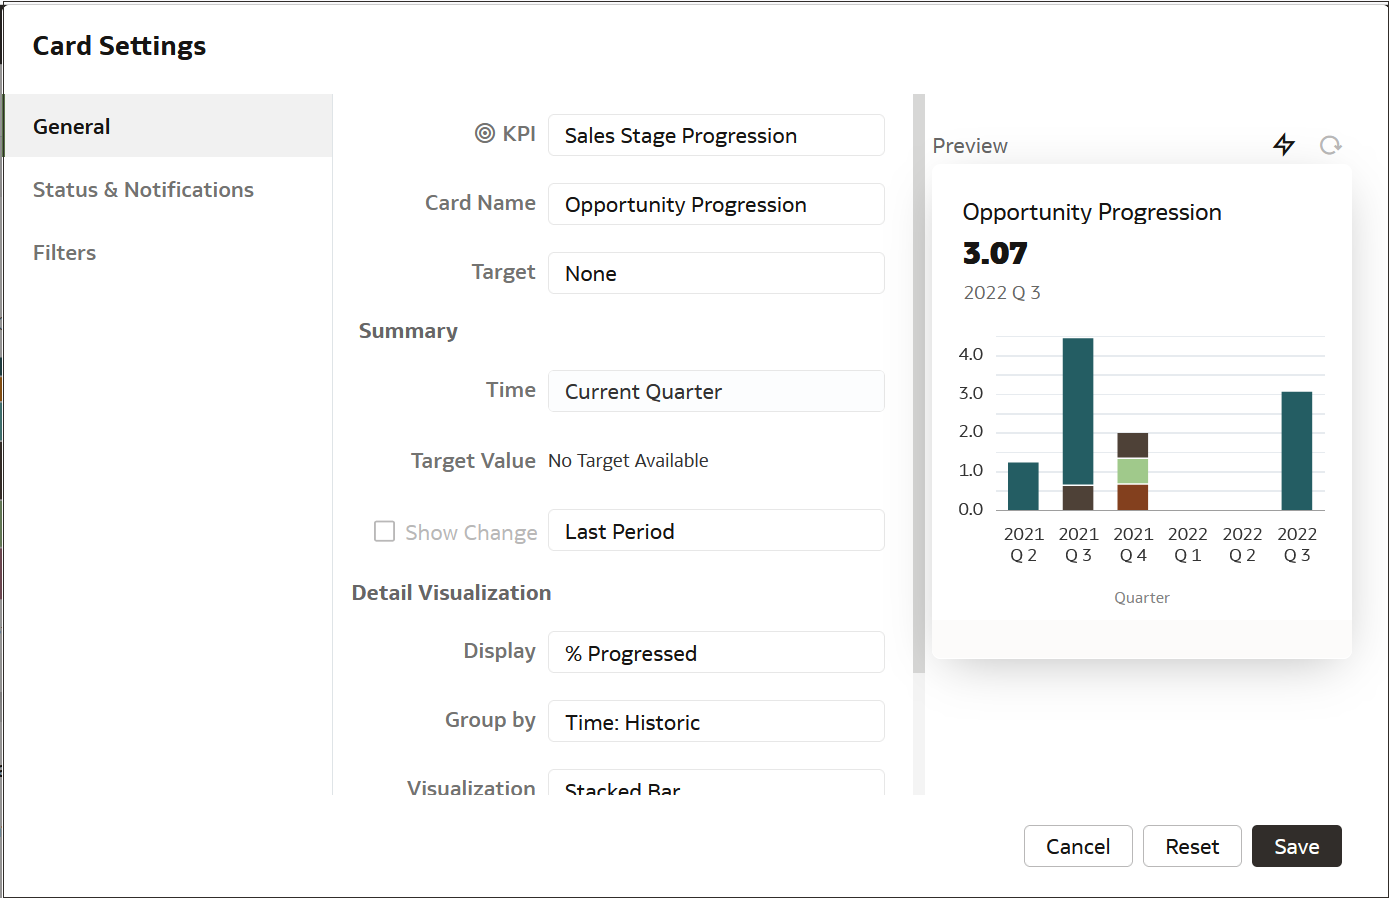
Customize a Card
You can customize cards to provide specific detailed information.
You can modify individual cards to show specific data about a KPI definition
such as target value, time period, and which measure to display on the
card.
- From the Decks view, click the Actions menu on the card you want to customize and select Customize.
- Select General.
- Edit the Card Name, which is based on the name of the KPI.
- Update the Target, which lists all measures defined for the KPI, and calculates the card status. Targets are based on dimensional breakout or across the breakout depending on how the target is defined in the KPI.
- Specify a period to show data in the Time field.
- Show the actual target Value or select a variance compared to the Target value.
- Show Changes over the prior period, same period last year, or year.
- Select which measure to Display in the card.
- You can Group by a dimension.
- Select the type of Visualization you want to display.
- Select Values related to the KPI.
- Select Groups by which to show the Values related to the KPI.
- Specify where the Legend appears on the visualization.
- Display Plot Area Values and Axis Labels to show the numeric values and scale shown in the preview.
- You can filter data by any criteria (except time data which is set in the Time field in the General tab).
