4 Build Analytical Applications
The Oracle Fusion Data Intelligence applications currently leverage a smaller number of Overview Dashboards that provide high-level summary information. These can drill down to a larger number of Detail Dashboards. Each of the Detail Dashboards provide more in-depth analysis on facets of the business.
This section describes details of how you can construct Oracle applications and will be useful for building new content that looks similar and can extend the prebuilt content.
Topics:
About Overview Dashboards
The Overview Dashboards typically present a limited number of metrics centered on a business topic that show the state of the business.
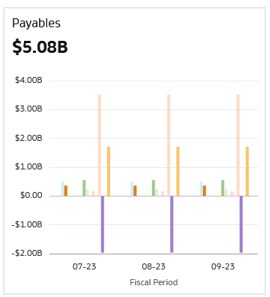
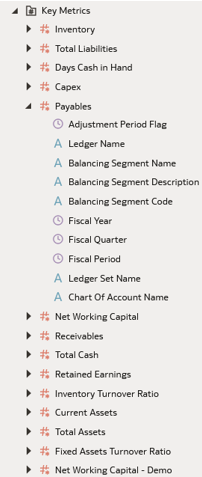
Composite visualizations on these depict an aggregate number for a specific business metric alongside a more detailed visualization that further illuminates that metric usually over time. These metrics are underpinned by their respective key metrics contained in a subject area or dataset. Key metrics are reusable across content and provide an opportunity for a common, shared business understanding.
Use Filters in Overview Dashboards
In the Overview Dashboards, you can create the filters that are meant to be seen and used by end users as Dashboard Filters.
The Overview Dashboards use Workbook Filters (seen in the top Filter Bar) behind the
scenes. 
To simplify consumption of business content, you can hide the Workbook Filters
by turning the Filter Bar off in the Present Mode for the end user.
The Dashboard Filters may use their default behavior to show the values of the subject area column or may be populated by parameters.
Use Parameters in Overview Dashboards
The Overview Dashboards use parameters to populate variables using data referenced in the subject areas.
Beyond the default set of parameters provided, specific parameters in the prebuilt
content have been built to dynamically request values for columns like “Fiscal Calendar”
or “Fiscal Year.” This allows the Overview Dashboards to avoid defaults and retrieve
appropriate values for users. 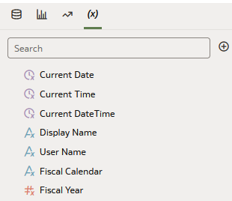
- Fiscal
Calendar
SELECT "Financials - GL Balance Sheet"."Time"."Fiscal Calendar Name" from "Financials - GL Balance Sheet" FETCH FIRST 1 ROWS ONLY - Fiscal
Year
SELECT  "Financials - GL Balance Sheet"."Time"."Fiscal Year"  FROM "Financials -
      GL Balance Sheet"  WHERE ("Financials - GL Balance Sheet"."Time"."Trailing Year Number" = 0 AND "Financials - GL Balance
      Sheet"."Time"."Fiscal Calendar Name" IN (@parameter("Fiscal Calendar")(''))  )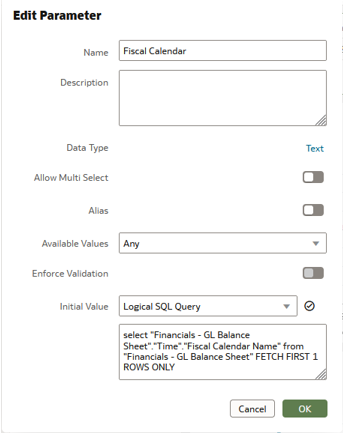
These parameters are then used to populate filters and default values on the Overview Dashboards.
Parameter Binding
A dashboard filter can be bound to a parameter. In this case, the “Fiscal
Calendar Name” dashboard filter is then populated by the “Fiscal Calendar”
parameter. 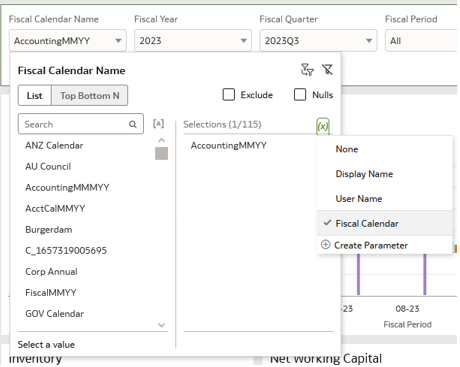
Role-playing Parameters
Usually a filter affects only one column, but in the case of
role-playing parameters the filter effectively "impersonates" multiple columns. In
some cases an Overview Dashboard is built so that the values selected in a single
dashboard filter can be propagated to more than one subject area column. This works
best if each of these columns has the same set of values. For this use case, a
Workbook Filter is used to map multiple columns to a parameter. For example, in this
case the “Accounting Calendar Name” columns will be populated by the “Fiscal
Calendar” parameter. As mentioned in the "Parameter Binding" section, the “Fiscal
Calendar” parameter also populates “Fiscal Calendar Name.” Using this dashboard
filter would update both columns. Here's the Workbook Filter where the mapping is
specified: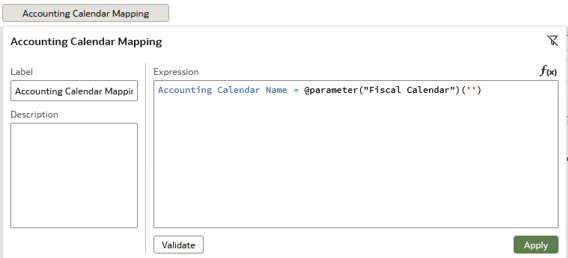
About Detail Dashboards
The Detail Dashboards are targeted from the Overview Dashboards.
They typically extend workflows that begin as high-level analysis in the Overview Dashboards and provide more analytical detail on a particular topic. For example a “Payables” tile might drill down to a “Payables Analysis,” or a “Headcount” tile might drill to a “Workforce Composition” or “Turnover” Analysis.
Create a Detail Dashboard
Data Actions describe the linkages between Overview and Detail Dashboards and they are built to designate the desired context to be shared between workbooks.
You can also create links that ignore any context from the parent Overview Dashboard.
Use Parameters in Detail Dashboards
You can duplicate the parameters from an Overview Dashboard and use them as a channel to pass context between the workbooks.
Ensure that you use the same parameter name and data type while duplicating. Also, ensure that the data action specifies the parameters that should be included in the context.
Pinning Parameters to Dashboard Filters
To maintain the value of a dashboard filter
across canvases within a workbook, you can use the parameters to replicate a “pinning”
behavior seen in Workbook Filters. In essence, the “pinning” behavior creates an empty
parameter and then each of the dashboard filters use "Parameter Binding" to shuttle that
value across the dashboard filters on multiple canvases. 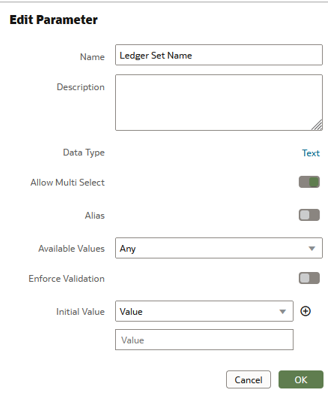
Add Filters to Detail Dashboard
Like the Overview Dashboards, you can create end-user-oriented filters on the Detail Dashboard as Dashboard Filters and hide the Workbook Filters at run-time.
Add Targets to Key Metrics
The Migration Utility might populate targets in key metrics and you can add them manually.
All users will see a shared target that exists as a column in a key metric;
and it will abide by user and data-level security rules. Typically, this target metadata
references a column directly or a calculation based on data. 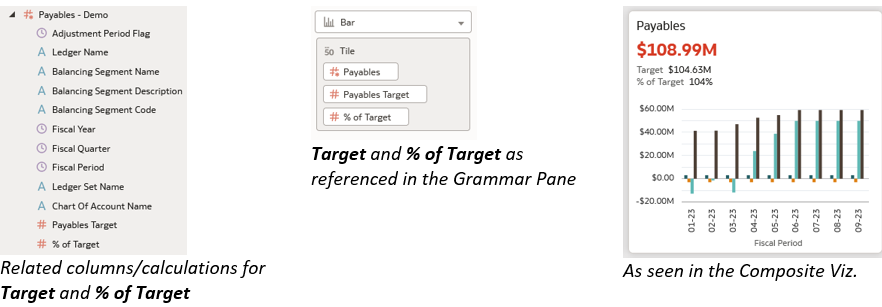
Add Conditional Formatting for Metric Status
Conditional formatting set on the key metric column and persisted at the dataset level is portable with the key metric. This means it can be shown whenever you use the key metric.
In this example, three statuses are described for Payables that are saved with the dataset.
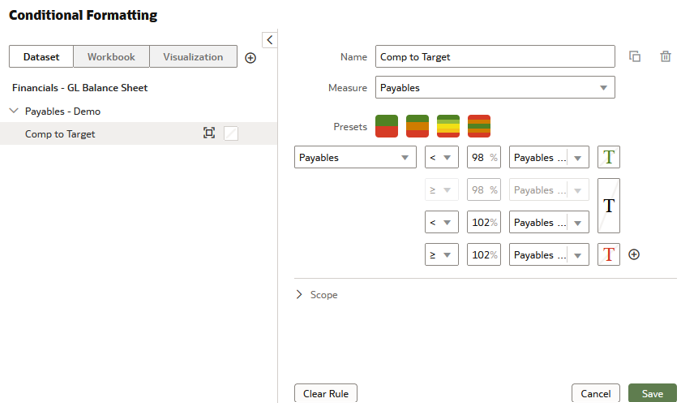
- #d63b25 = Critical
- #ac630c = Warning
- #508223 = Good