Add and Configure the Primary Chart for the First KPI_1 Dashboard Panel
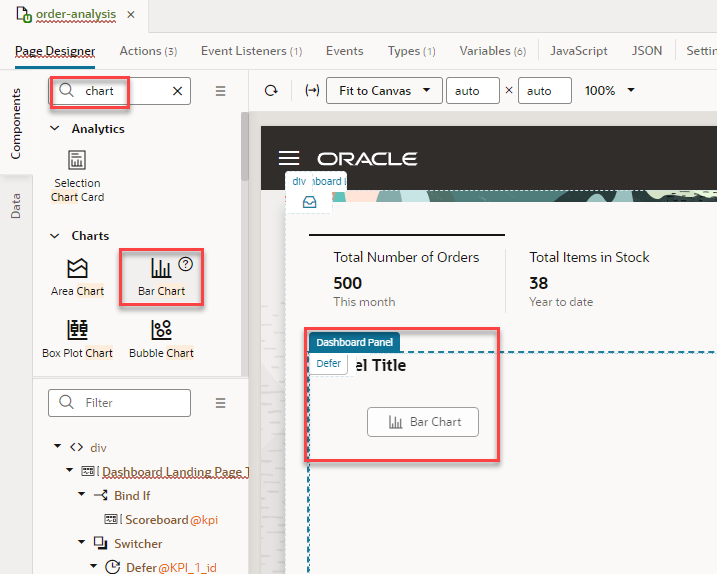
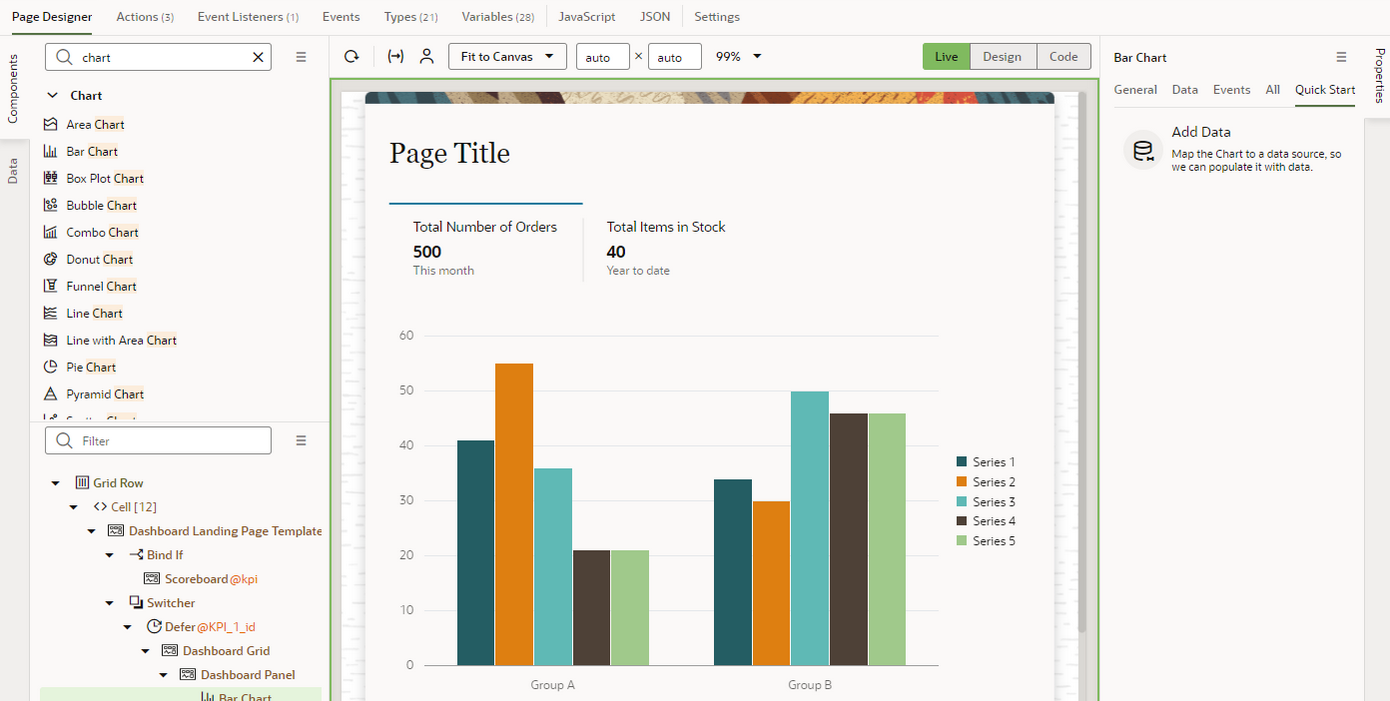
- Add a bar chart to the default slot of the KPI_1 dashboard panel.
- In the Components palette, search for chart.
- Click Bar Chart and drag it over Panel Title until that text is overlayed with Dashboard Panel, then drop it.
- If you see the Dashboard Panel | Slots dialog box, click
Default.

- Locate the data to add to the bar chart.
- In the Structure view, select Bar Chart if it's not already selected.
- In the Properties pane, on the Quick Start tab, click Add Data.
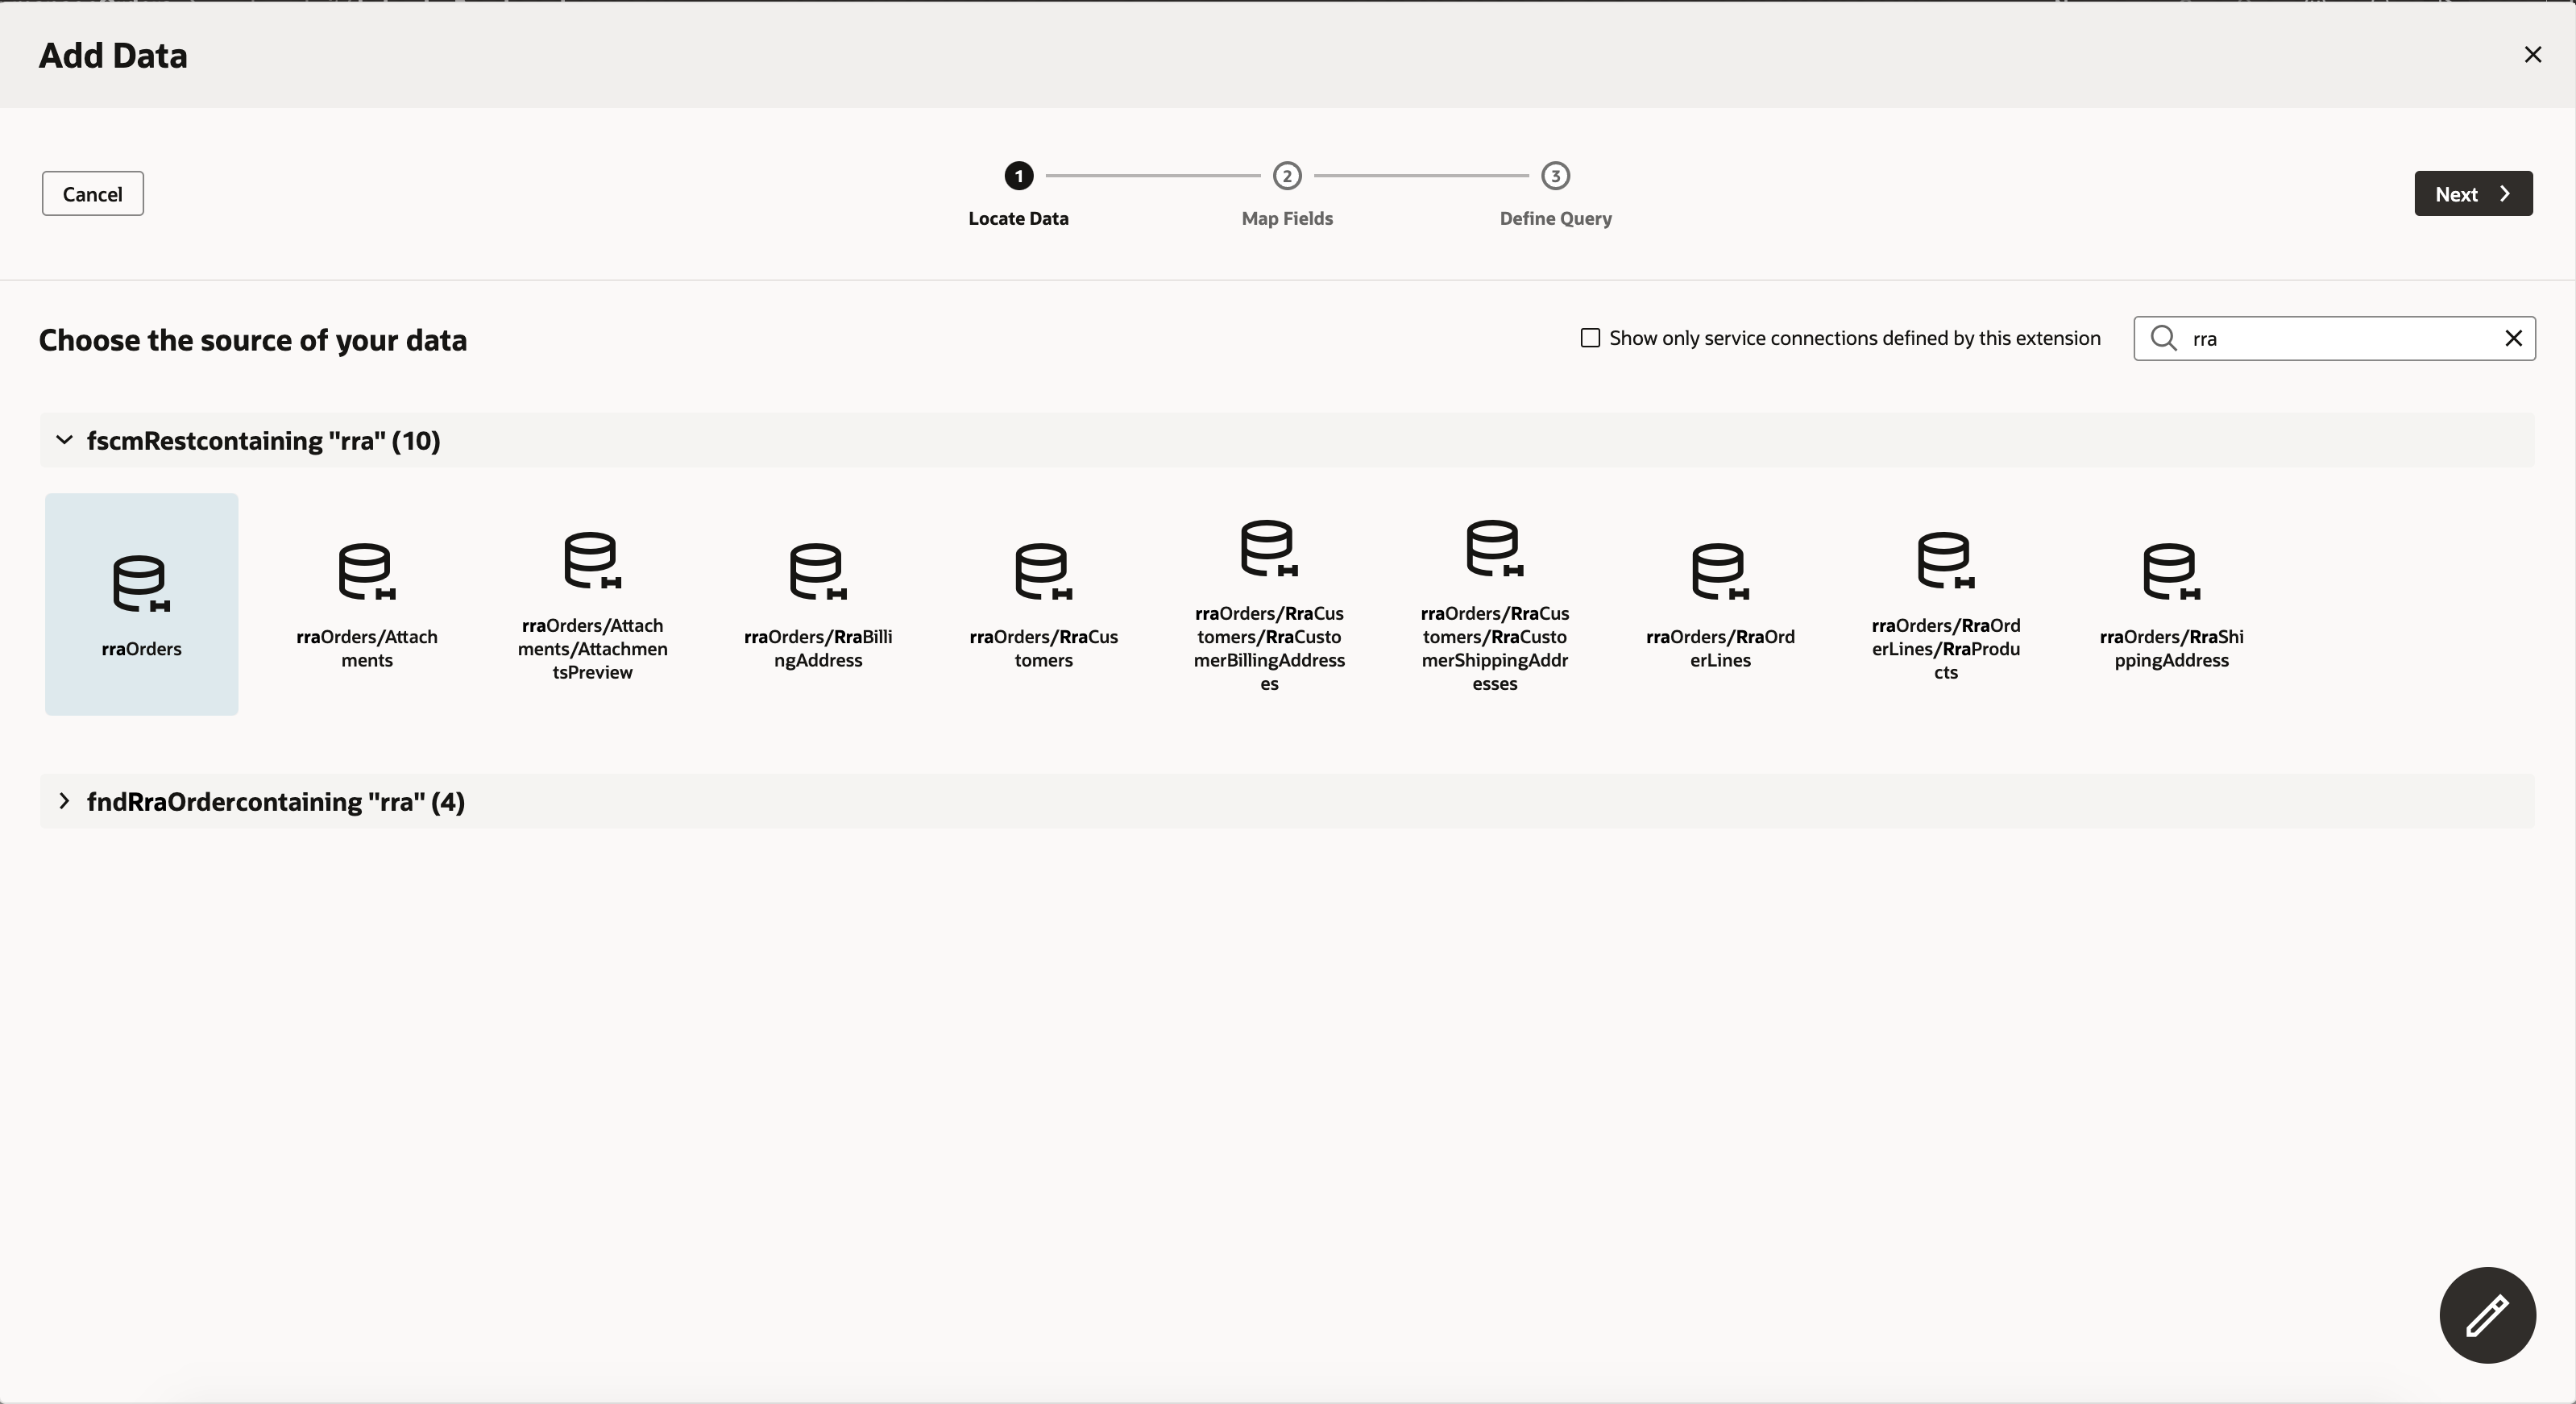
- On the Add Data dialog box, filter the data sources by entering rra.
- Expand fscmRestcontaining "rra".
- Select rraOrders.
- Click Next.
 The Bar Chart Component Fields page appears.
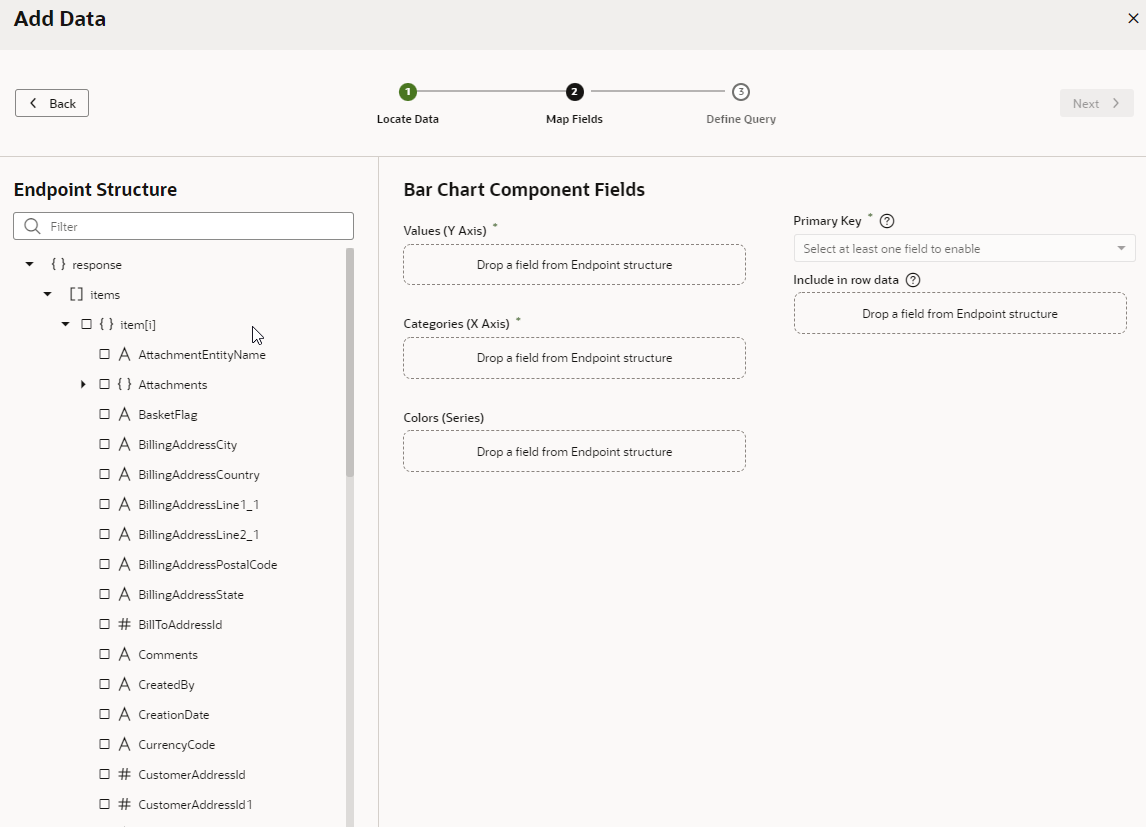
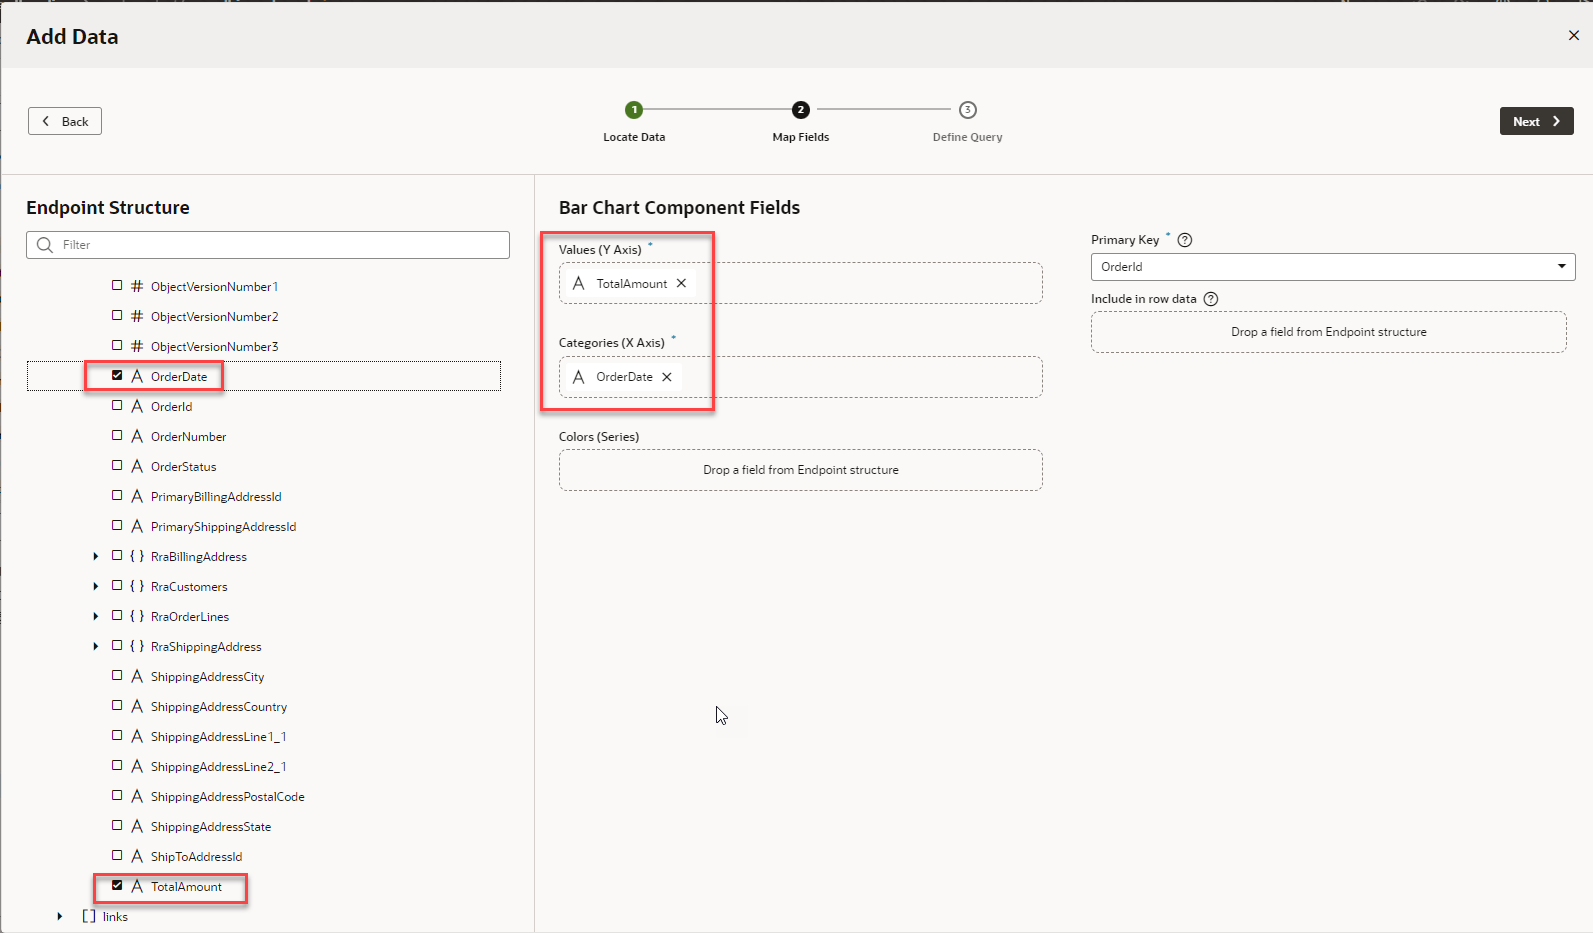
- Map the endpoints to the Y and X axes of the bar chart.
- On the Map Fields stop, in the Endpoint Structure panel, scroll to find and
select TotalAmount.
It should automatically appear in the Values (Y Axis) field. If it doesn't, drag the endpoint over the field and drop it.
- Select OrderDate.
It should automatically appear in the Categories (X Axis) field. If it doesn't, drag the endpoint over the field and drop it.
- Click Next.
- On the Map Fields stop, in the Endpoint Structure panel, scroll to find and
select TotalAmount.
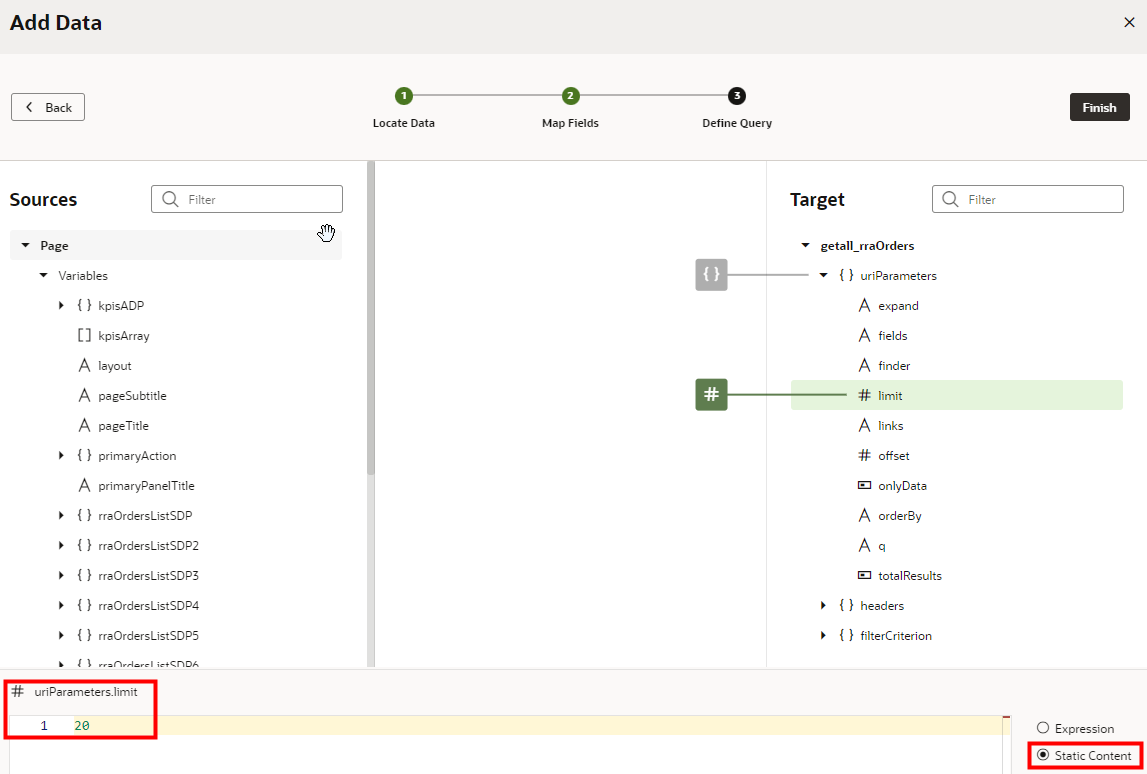
- Define the query so that it returns only 20 order dates at a time.
- On the Target panel, expand { } uriParameters.
- Click # limit.
- In the # uriParameters.limit field at the bottom of the dialog box, enter 20.
- Select the Static Content option, if it isn't already
selected.
 Tip: By default, the query returns the first 20 order dates it finds. You can make the query more specific by adding an appropriate expression to the Target orderBy parameter.
 - Click Finish.
 Note: If you are not seeing the Chart in the Live view, or if you are seeing errors related to Total Amount being a String, in the Code view, replace
<oj-chart-item value="[[ $current.data.TotalAmount ]]"with<oj-chart-item value="[[ Number.parseFloat($current.data.TotalAmount) ]]".If you are still not seeing the Chart in design time Live View after making these changes, try using the Preview mode.
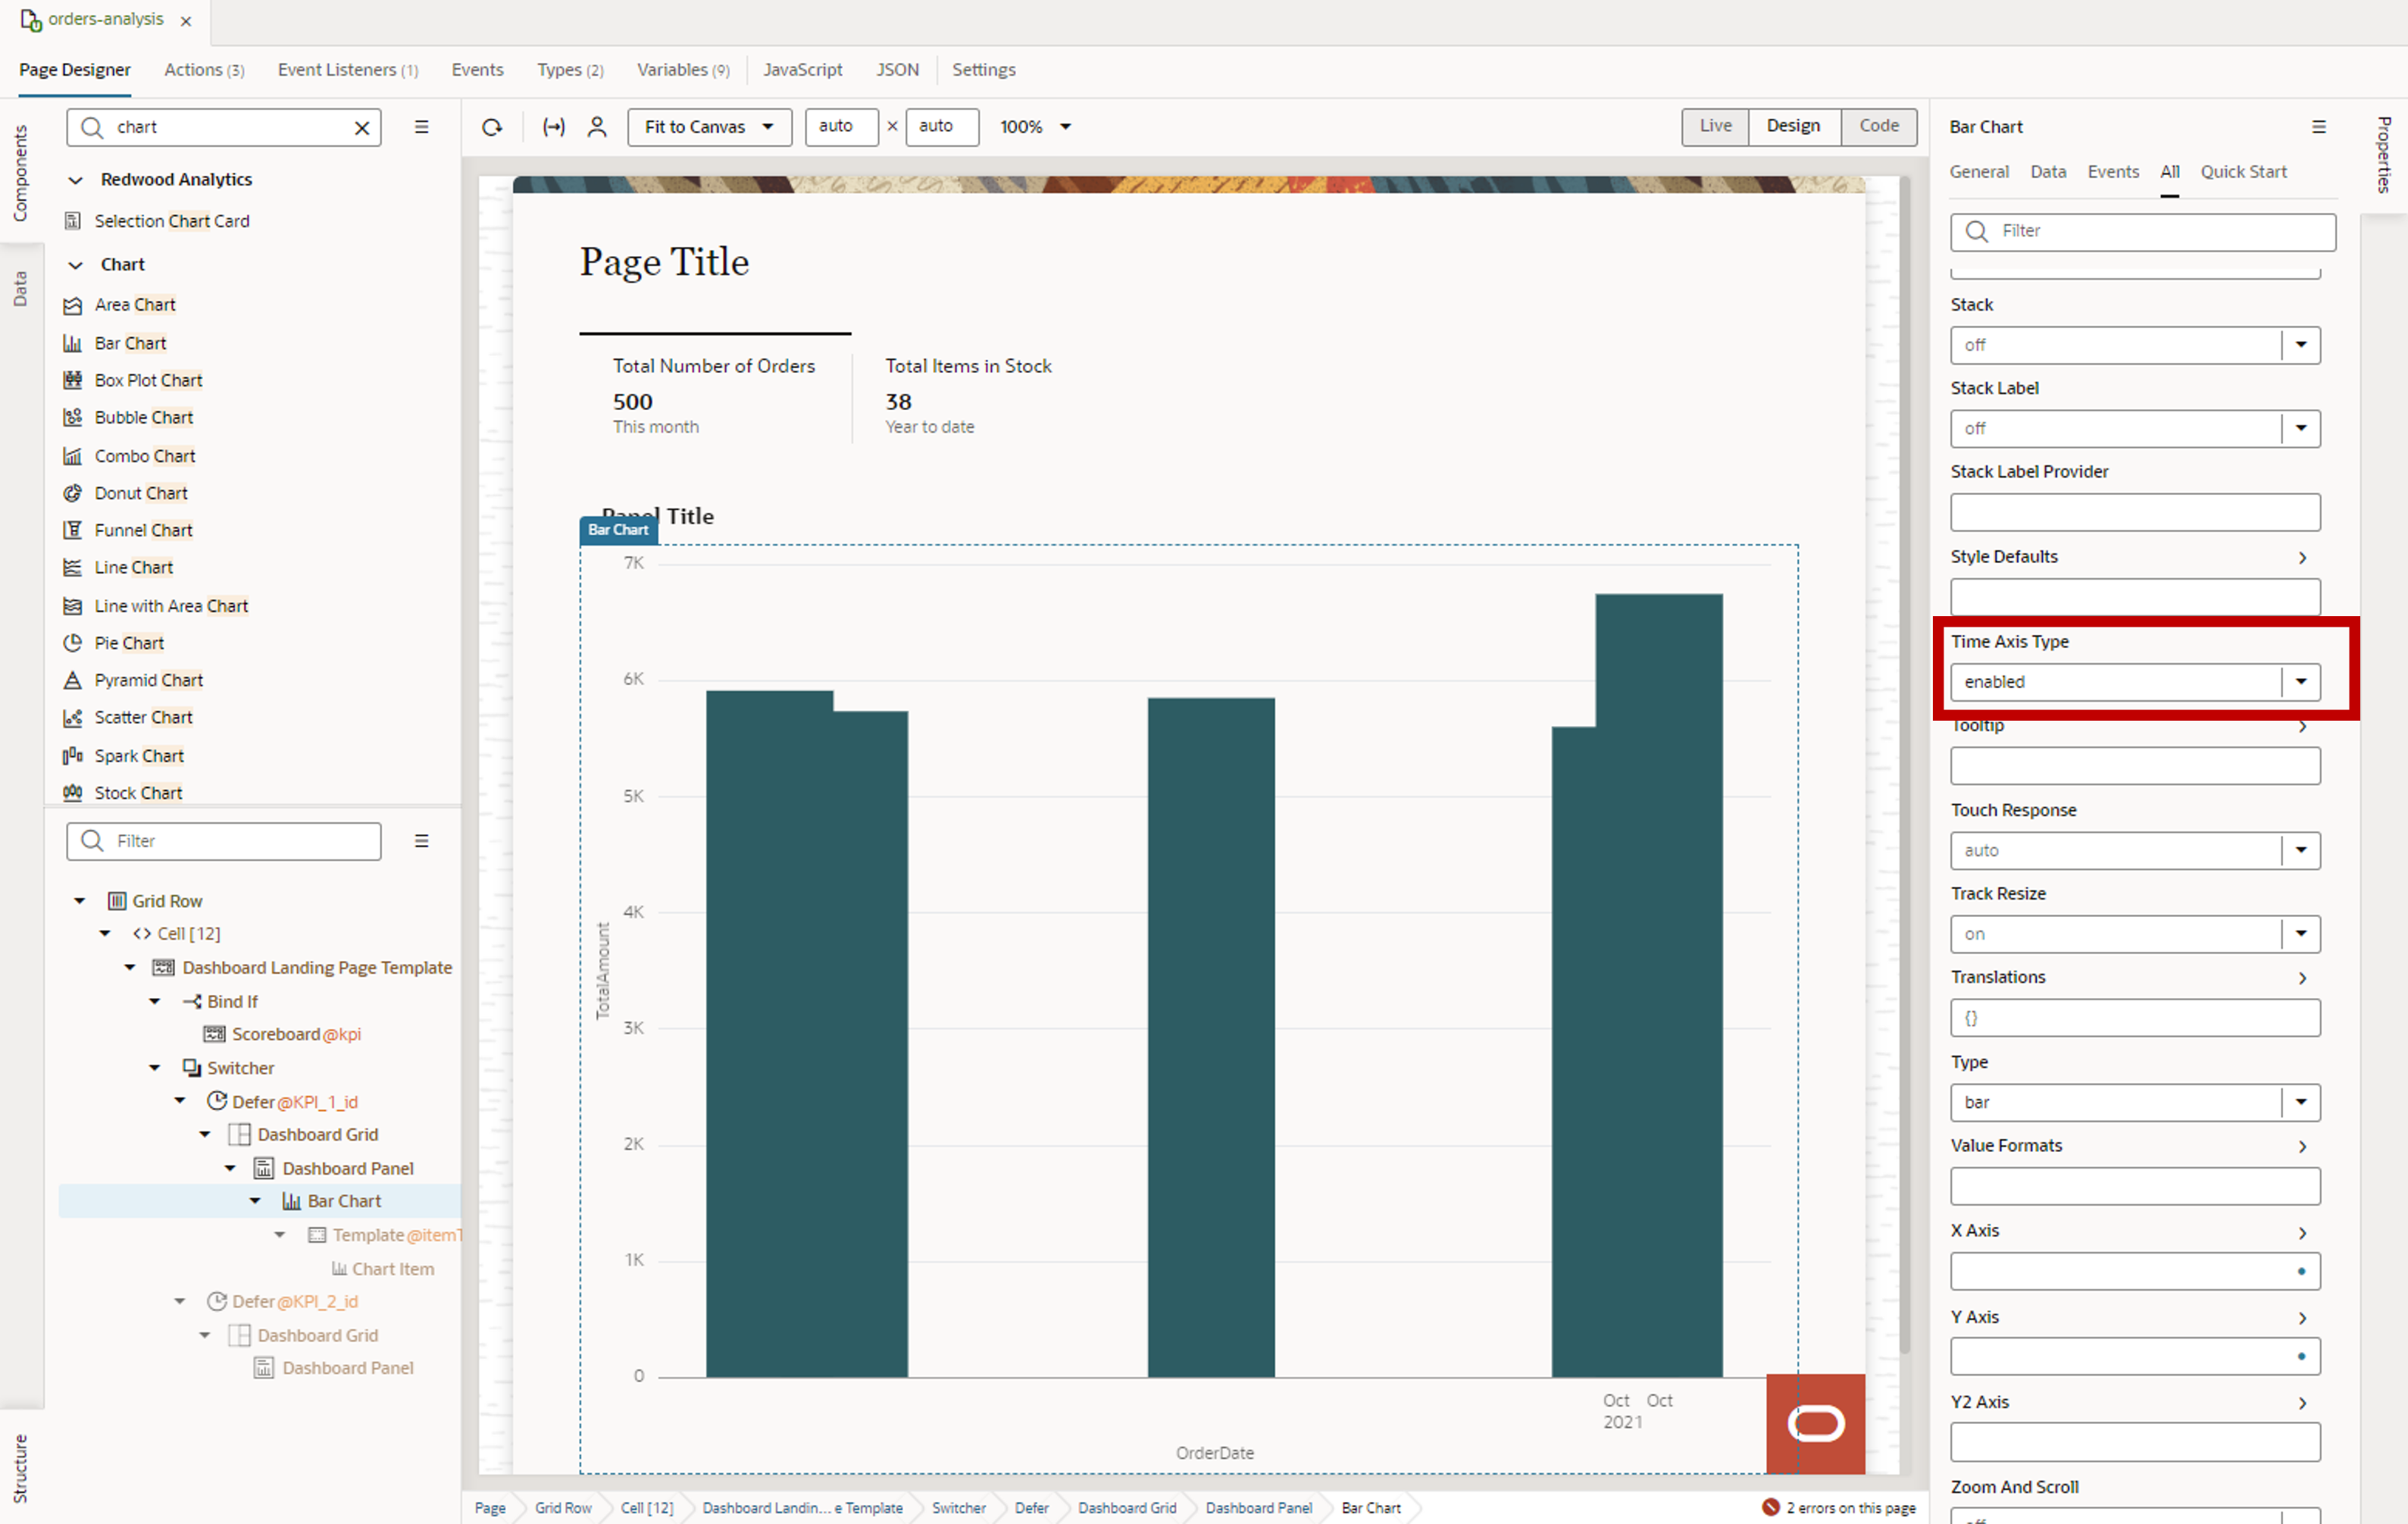
- To provide a clearer layout for the dates, enable the time axis for the bar chart.
- Make sure that Bar Chart is selected in the Structure view.
- In the Properties pane, on the All tab, scroll to Time Axis Type.
- Change the Time Axis Type value from
auto to enabled.
 Note: After this step, you see a series of errors in a notification at the bottom of the page due to string type mismatch. To resolve these errors:
- Click the Types tab, expand , and click TotalAmount.
- In the Properties pane, Type field, replace
String with
Number.
![The Types tab displays with getallRraOrdersResponse, items, items[i] expanded, and # TotalAmount outlined in red. The Properties pane, Type field is outlined in red.](images/image2022-11-7_10-31-54.png)
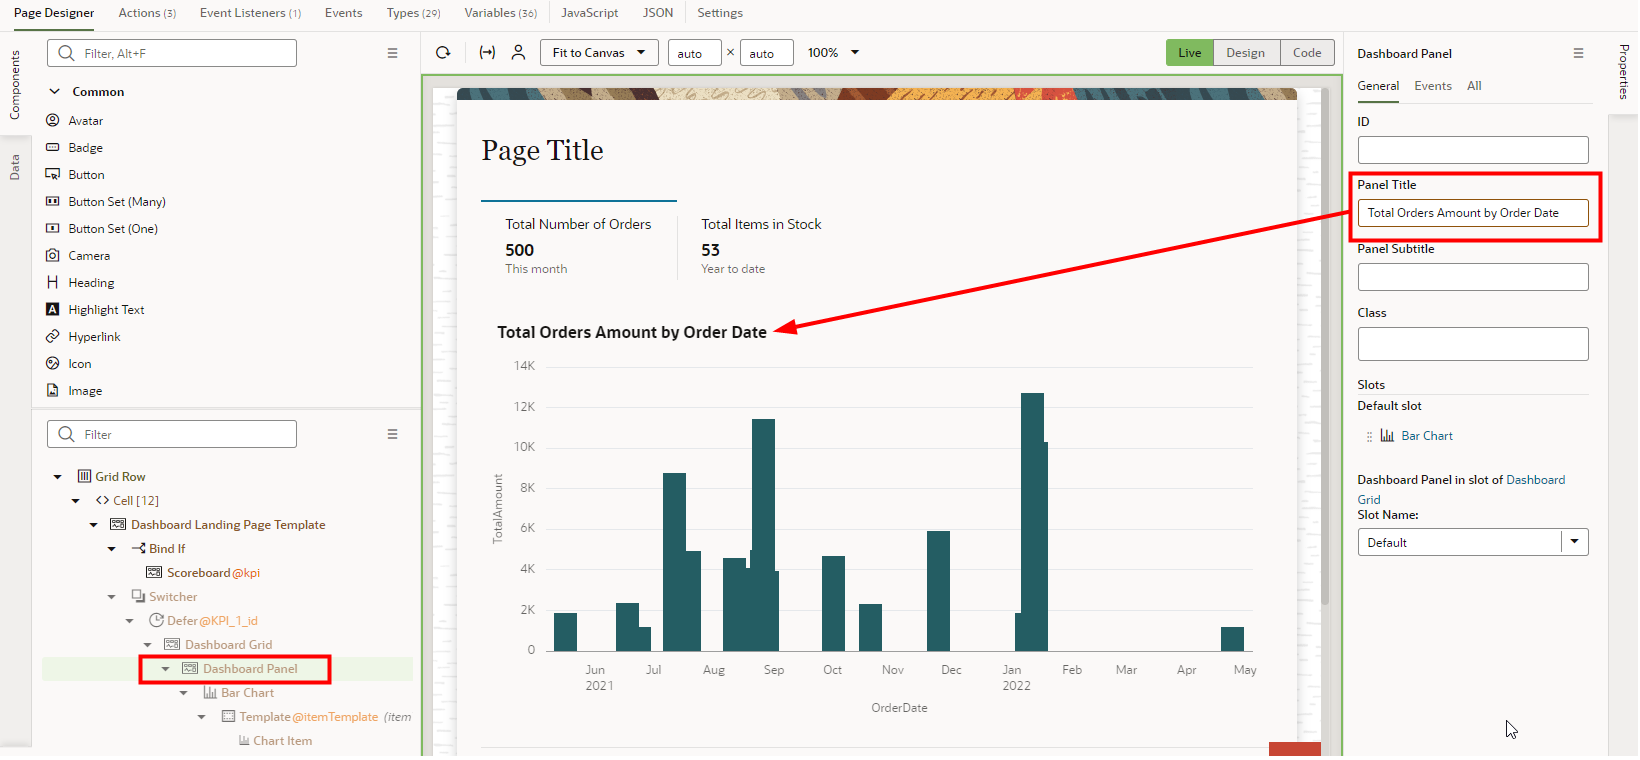
- To address accessibility, add a title to the dashboard panel.
- In the Structure view, under Defer @KPI_1_id, select the Dashboard Panel component.
- On the Properties pane General tab, in the Panel
Title field, enter Total Orders Amount by Order
Date.