Add Output Columns to a Report
In this procedure, we will add two columns to the report’s first output level, displaying incident queues and the number of incidents in each queue.
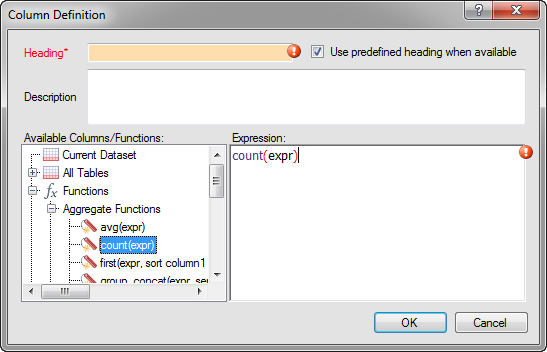
- Select Aggregate Functions and then
drag count(expr) onto the design surface. The Column Definition window opens where you select the field
you want counted.
We will edit the column’s expression to specify what records we want counted. In this example, we want to count the incidents in each queue.
-
Scroll down to Incident ID (i_id) and drag it to the text
between the parentheses on the right side of the window. After you do this, the column’s
expression will be count(incidents.i_id).
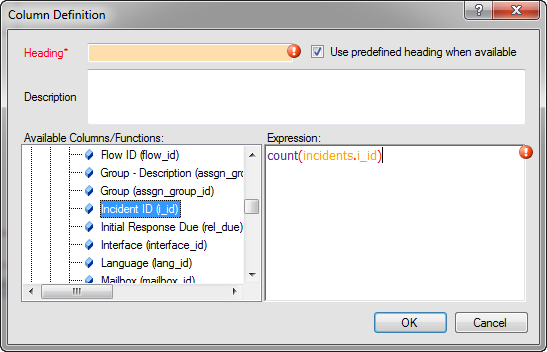
We want to count the records using this field since it's a unique identifier for incidents as no two incidents share the same ID number.
Results:
The first output level of the sample report now has two columns displaying incident queues and the number of incidents in each queue. For more information about adding output columns to reports and the types of columns you can add, see Overview of Report Output Columns.